Cryptocurrencies have been in a downward spiral since the end of 2021, and this fall seems to have no finish line. Central banks all over the world hike interest rates to tame inflation, which is sending assets like stocks and cryptos downward. But there are signs of a possible end to this torture.
Total crypto market cap
The total market capitalization of cryptocurrencies has already fallen by more than two-thirds, from $3 trillion to today’s $910 billion (this number will differentiate throughout several portals). This indicator shows if there is a downtrend or uptrend pretty well. Now it is a clear bear market, but some signals point to a potential bottom in a few weeks. The sharp drop in the second quarter of this year stopped at the peak of the 2018 bull market. Is this the bottom?
Related article: Crypto adoption increases – investors need to stay vigilant
The 2018 bear market was simply caused by an overvalued market and a cycle change. However, 2022 is fighting with all that from 2018 plus raging inflation, high interest rates, stock market crash, high energy prices, etc. So the situation this year is much worse than it was in 2018. Nevertheless, the chart formed several divergences, and we anticipate another divergence to be developed before the upward correction is created. Last time the crypto market dropped by 90% before it found a bottom. Now it fell by 75%, so the bottom is potentially very close.
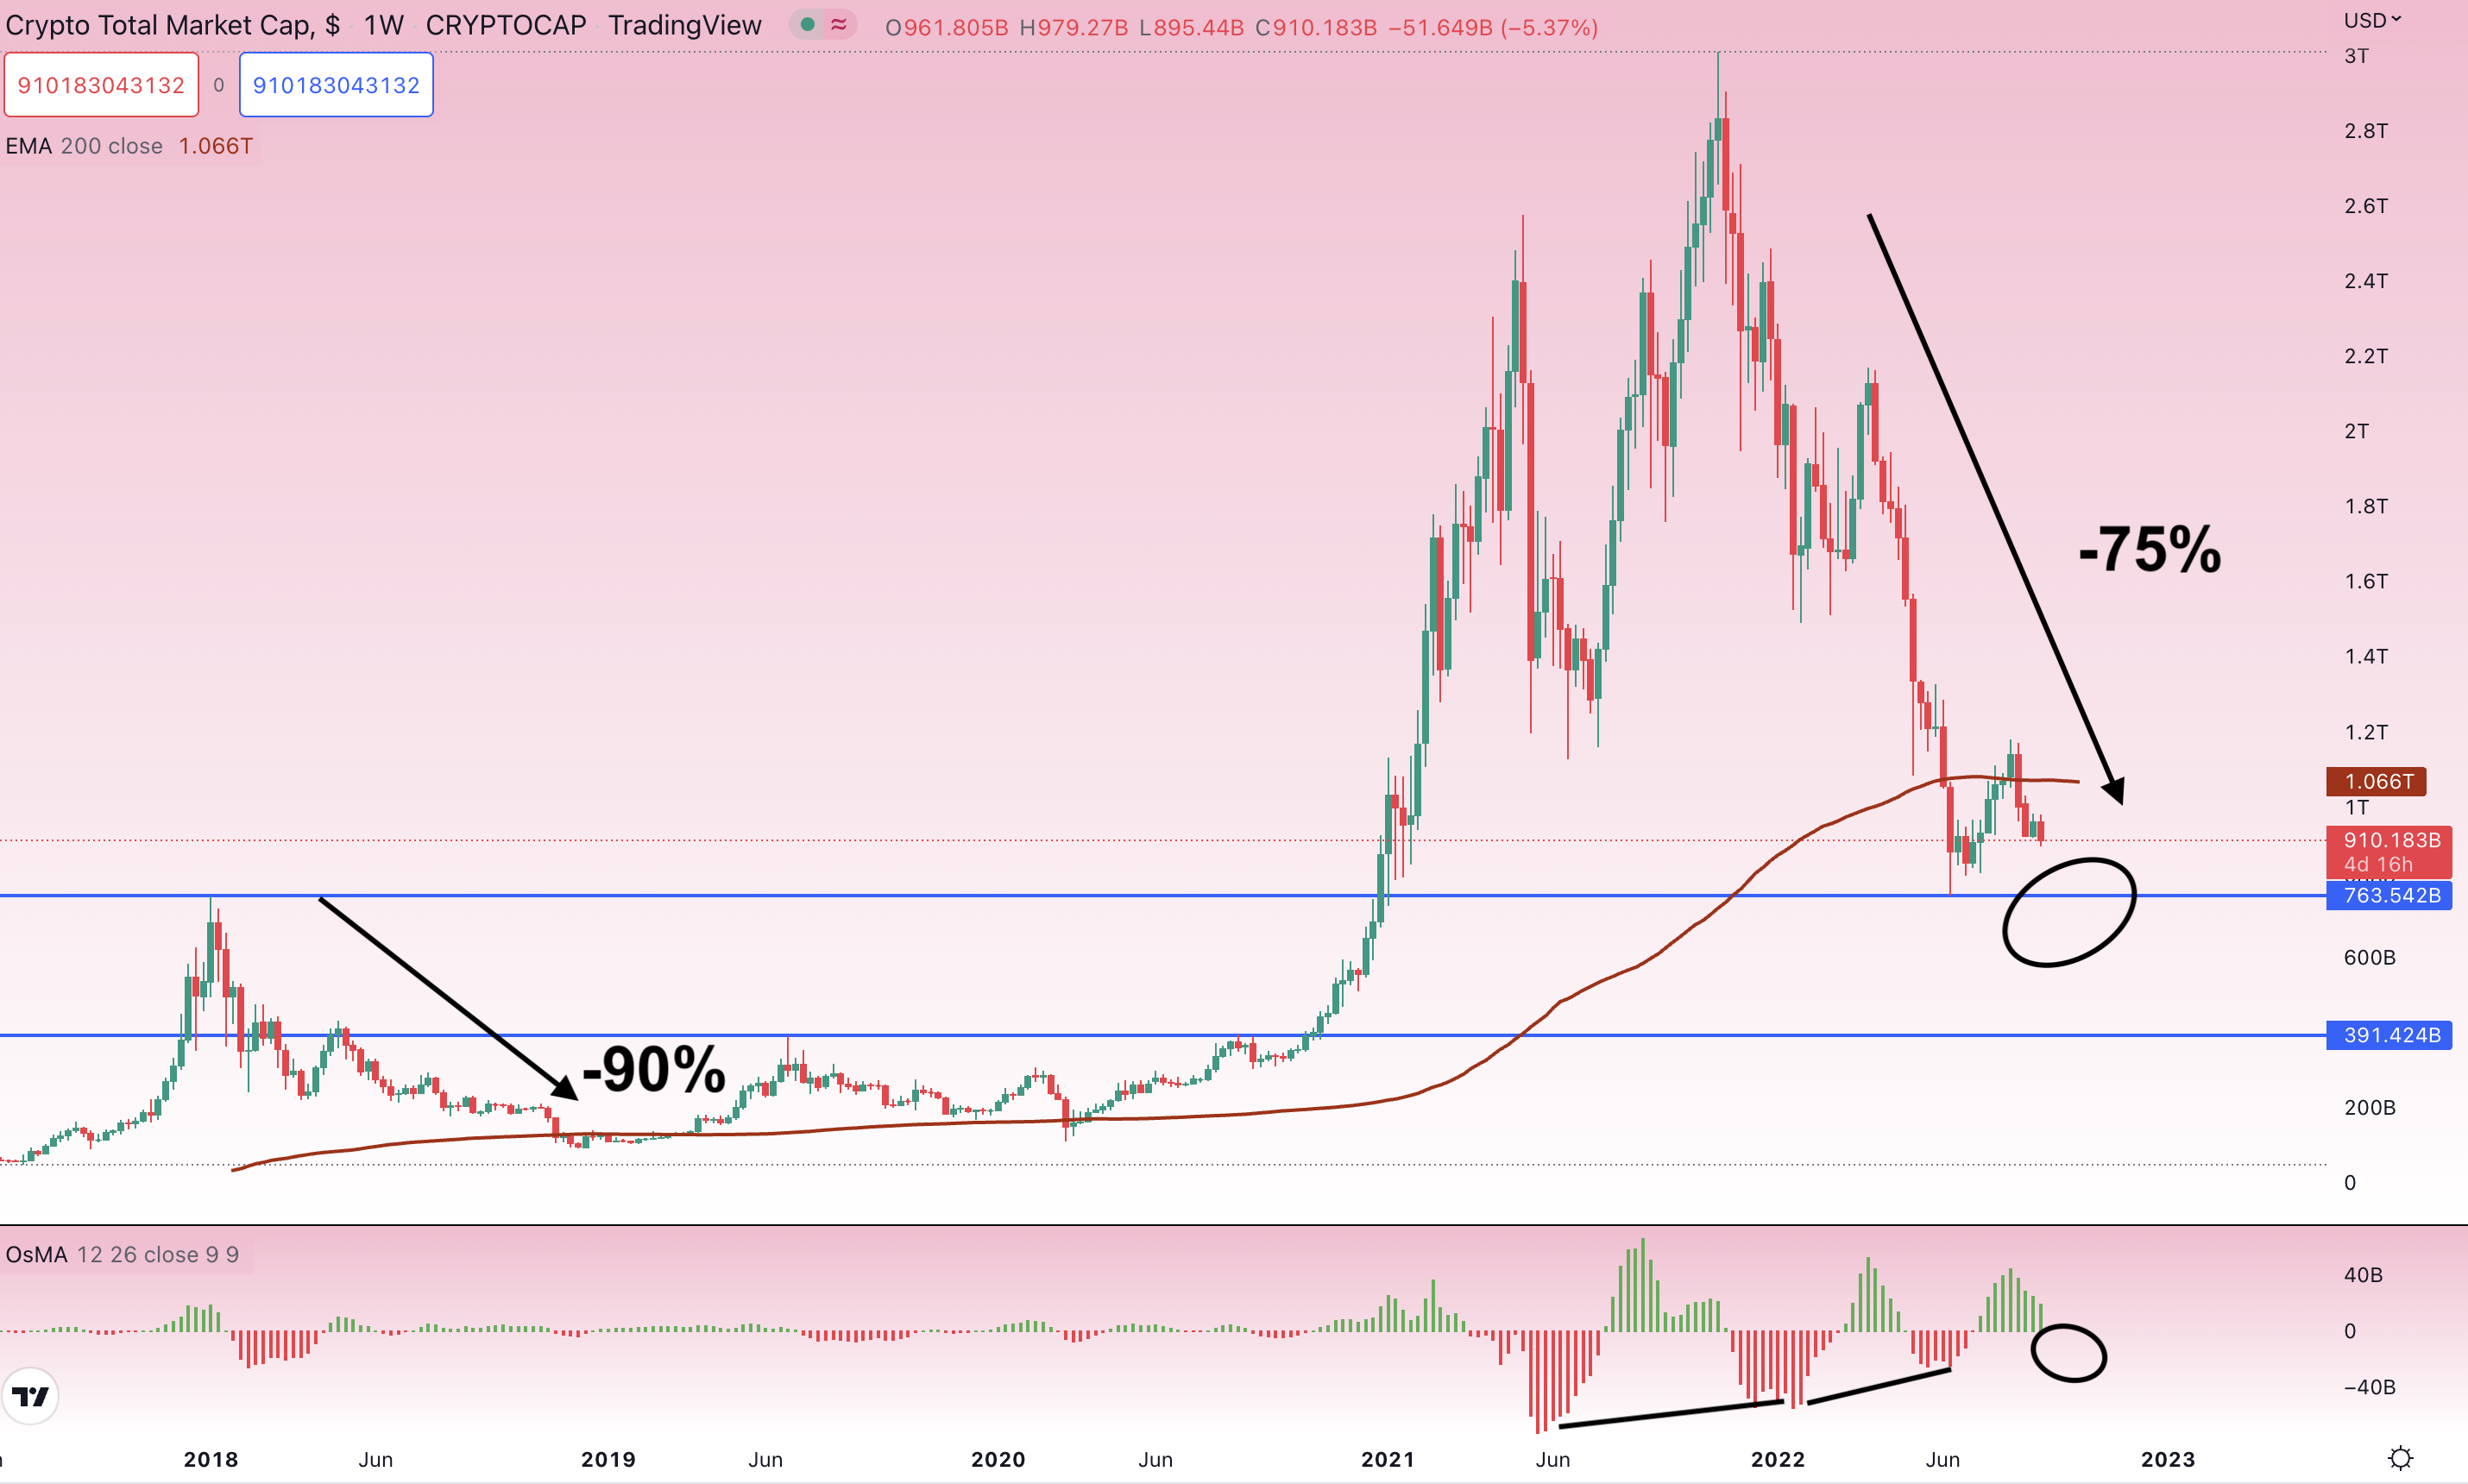
Total crypto market cap, source: tradingview.com
The rainbow chart says it all
We mentioned a fire sale signal here, and now the market is retesting the lowest part of the rainbow chart, a great long-term indicator of overbought and oversold areas. You can clearly see Bitcoin always goes up after the halving event, and the next one takes place in around 600 days. So while the bottom is probably not in yet, the rainbow chart says the market may bottom out soon.
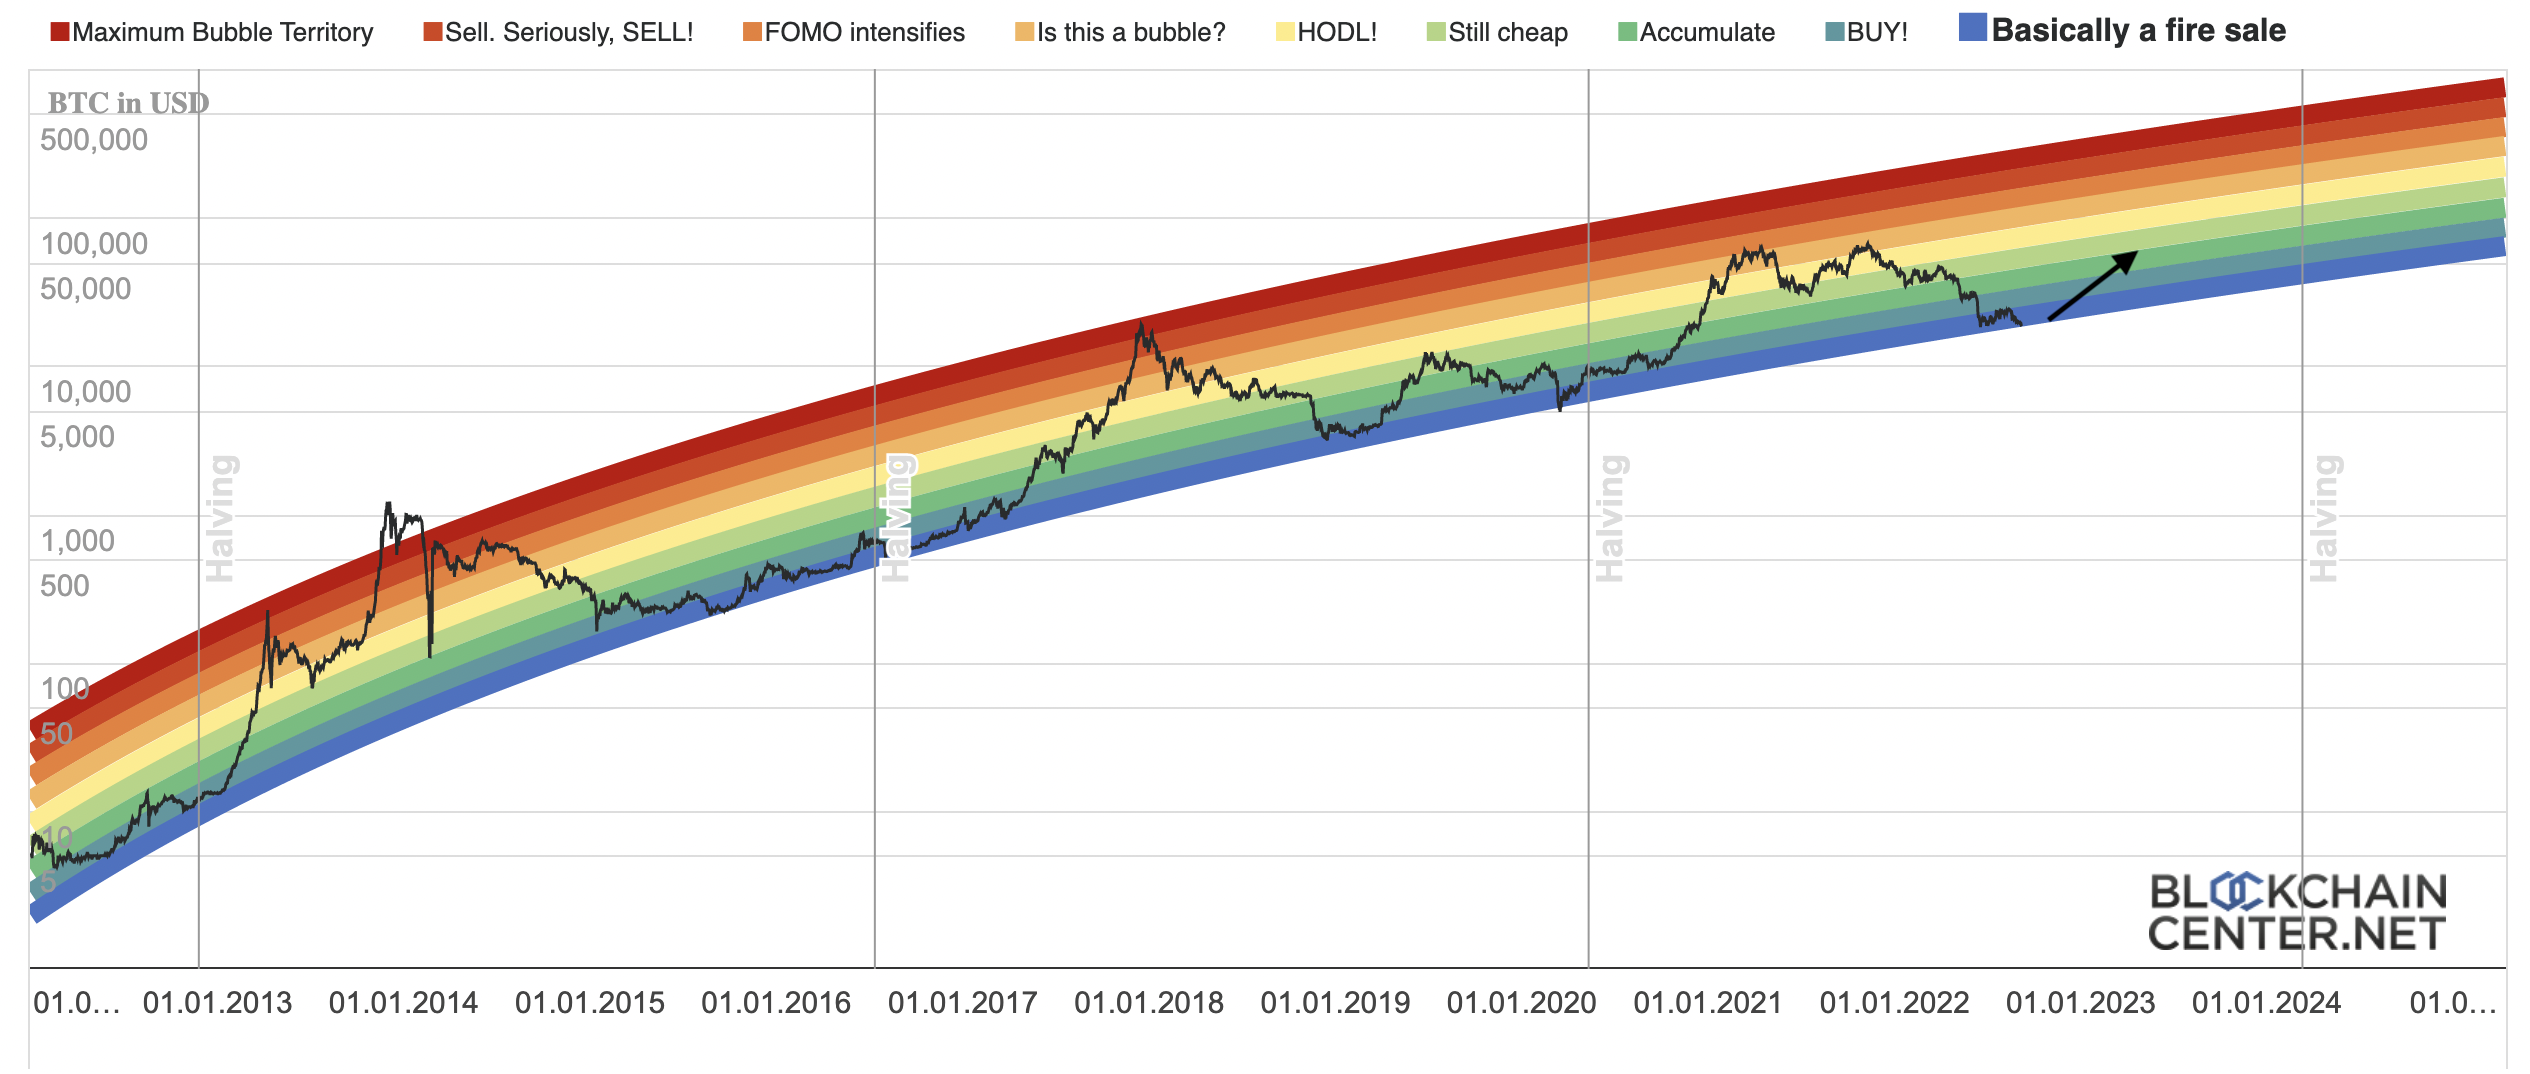
Rainbow chart, source: link
Bitcoin weekly chart
The historical comparison may also help determine the bottom in the crypto market, and it almost took the whole year in 2018 for Bitcoin to find its ground at around $3,500. Now it’s approximately 40 weeks, so nearly a full year. This also shows that the bottom might be closer than people think because if it takes a similar time to find the bottom, like in 2018, we might see at least a relief rally to $30,000 or higher.
Read more: OPEC+ unexpectedly cut oil’s output
You can also see temporary supports when you look at the OsMA indicator and that there are divergences that could send Bitcoin upward soon. But for the market to really bottom out, it would need to create at least one more decline in the indicator, leading to another divergence.
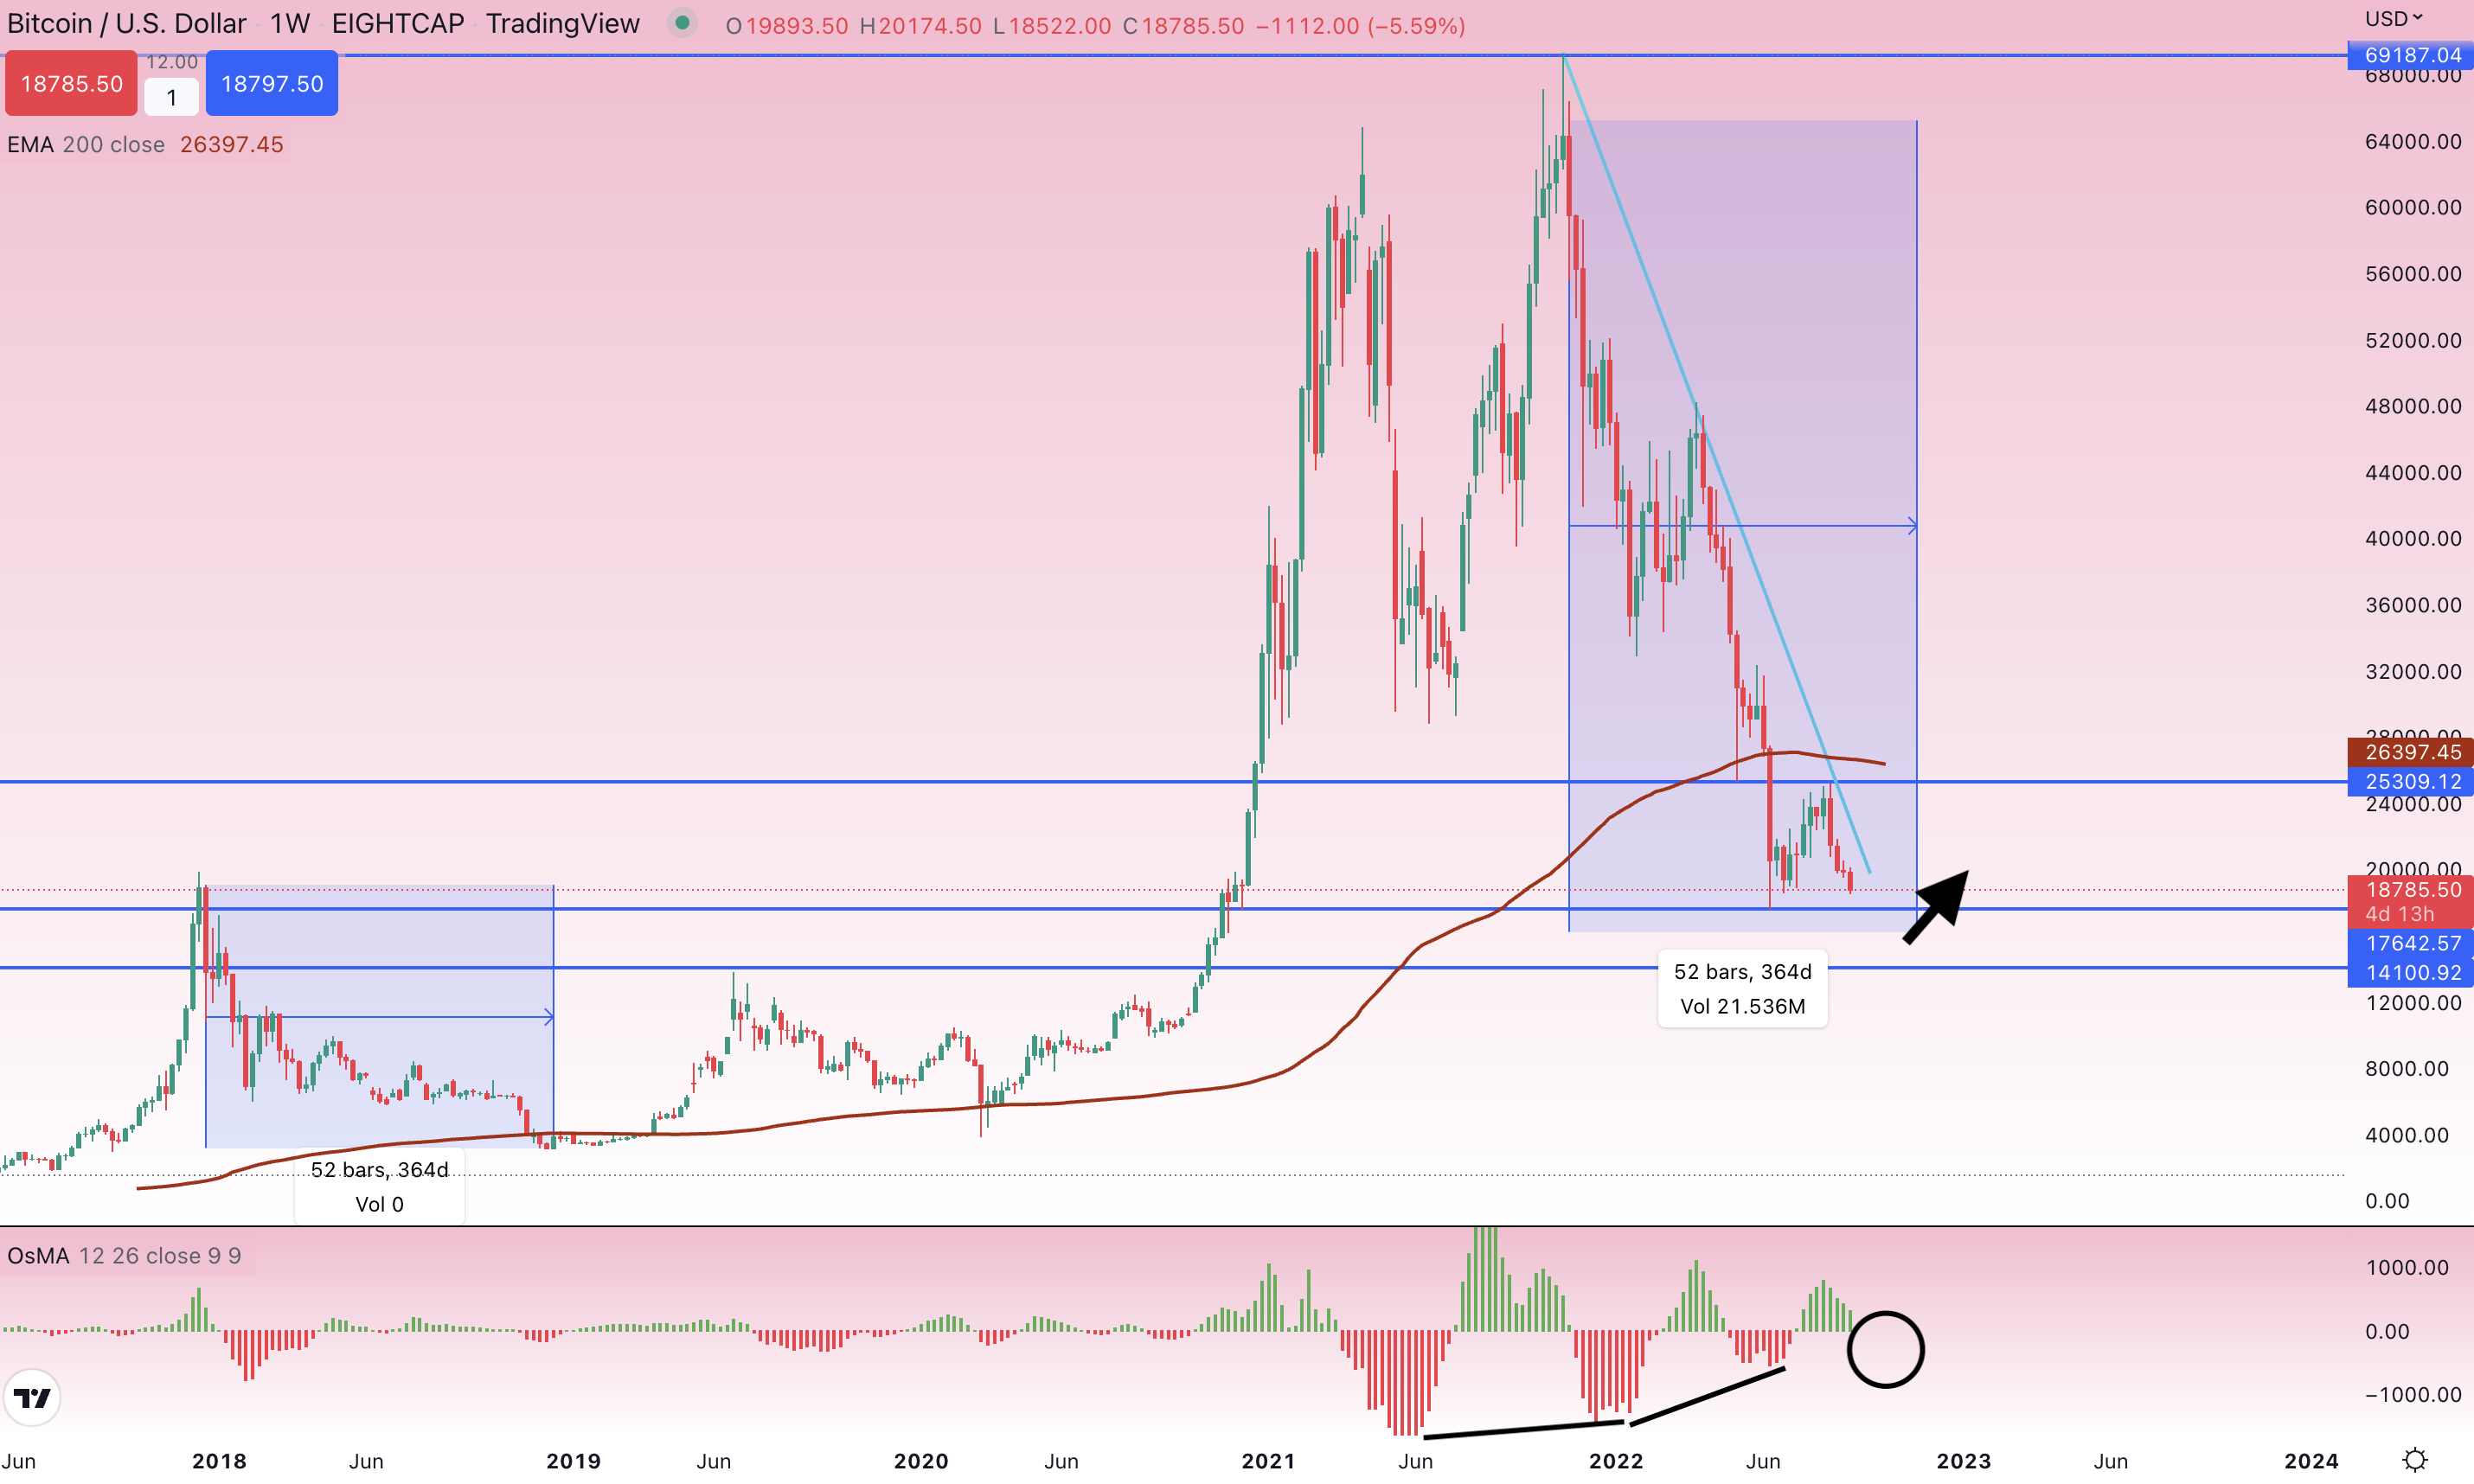
Bitcoin weekly chart, source: tradingview.com
Bitcoin daily chart
Bitcoin is clearly in a downtrend and entering a long position right now is considered very risky. The best investors and traders trade with the trend or enter buy positions on strong levels or when new lows are created. The retest of support or a new low (decrease in OsMA indicator as well) could be created in the near future, offering an exciting entry point that many probably didn’t anticipate.
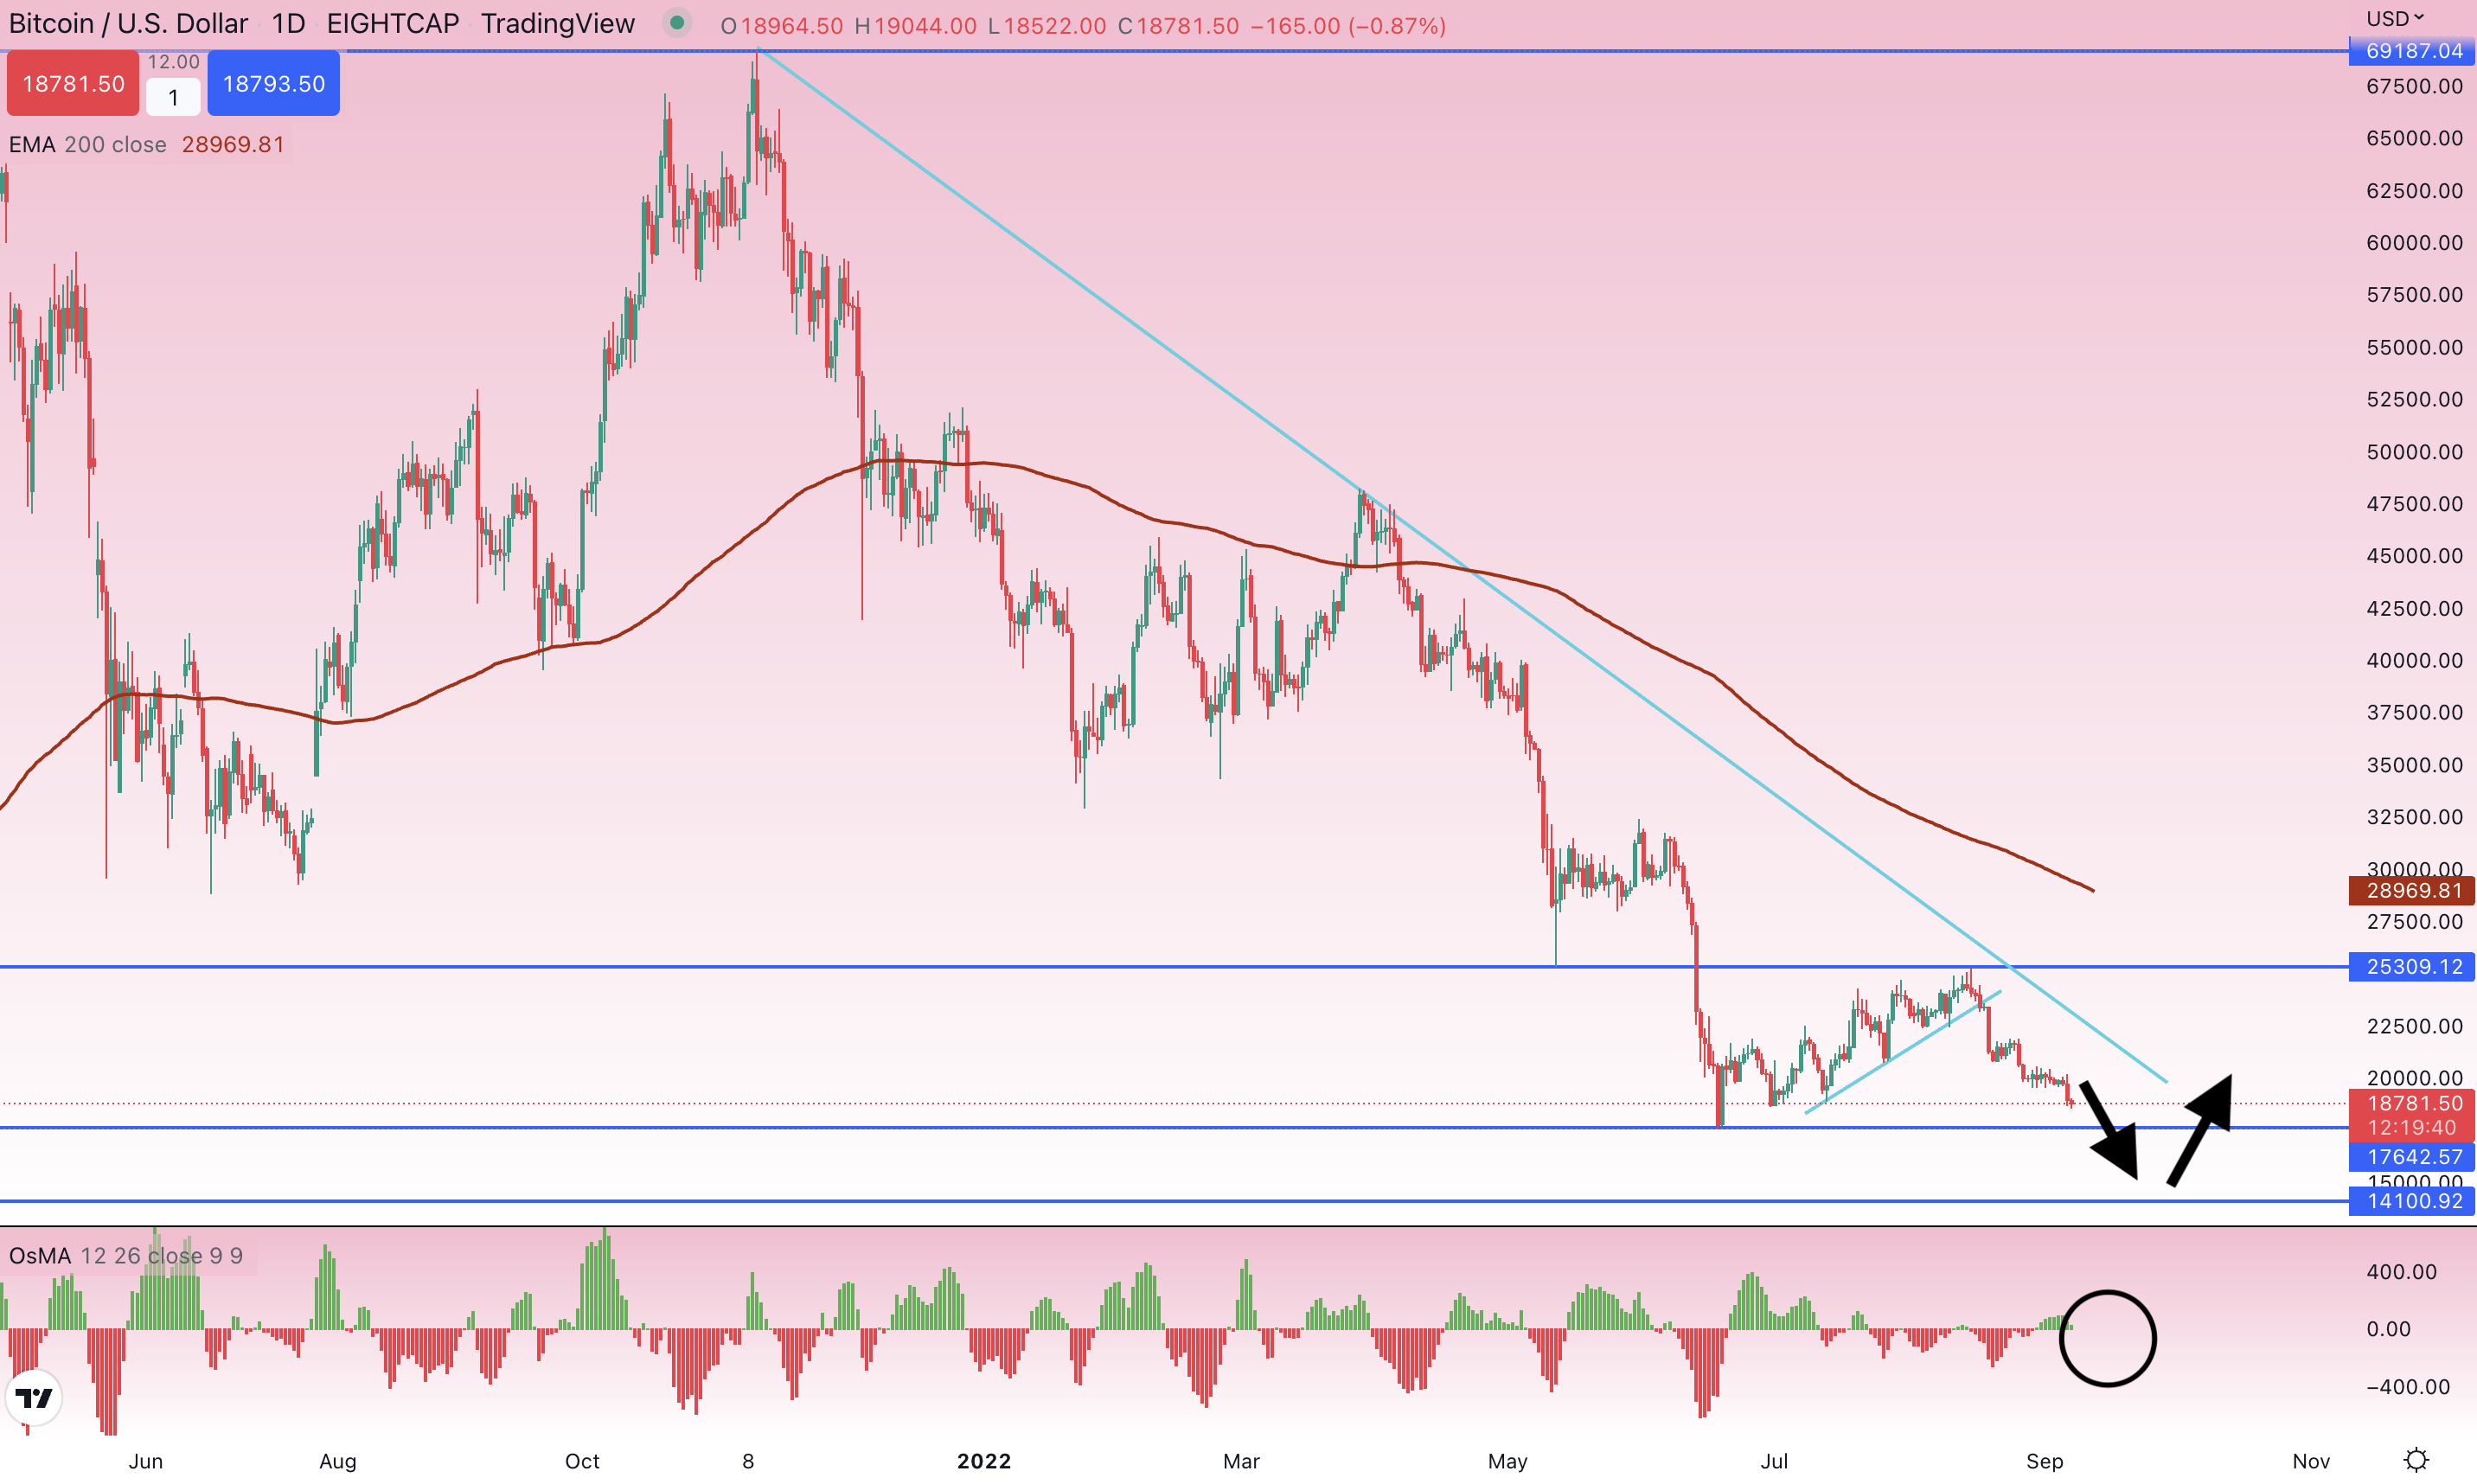
Bitcoin daily chart, source: tradingview.com
The bottom line
Many are trying to find the bottom, so make sure you do not go all in now as it is tough to estimate precisely. We only see it is potentially very close, so either avoid trading at the moment or choose a dollar-cost average (DCA).


Comments
Post has no comment yet.