“Where is the Bitcoin bottom” is a persistent question at times like these, when markets are crashing harder than ever before. Overvalued assets, rising inflation, and interest rates caused many people to think this is the end of crypto. But what if it isn’t?
Related blog: Crypto news summary: Celsius, Tony Hawk, and Sandbox
1. First break below its previous cycle all-time high level
Bitcoin with altcoins move in cycles like all other financial markets. However, Bitcoin is the most reactive to halving when miners’ reward pool decreases by half. The latest halving happened in 2020 and before that in 2016. It happens every 4 years, and BTC creates a new all-time high (ATH) level after this event. However, Bitcoin never got below its ATH from the previous cycle. But it happened now!
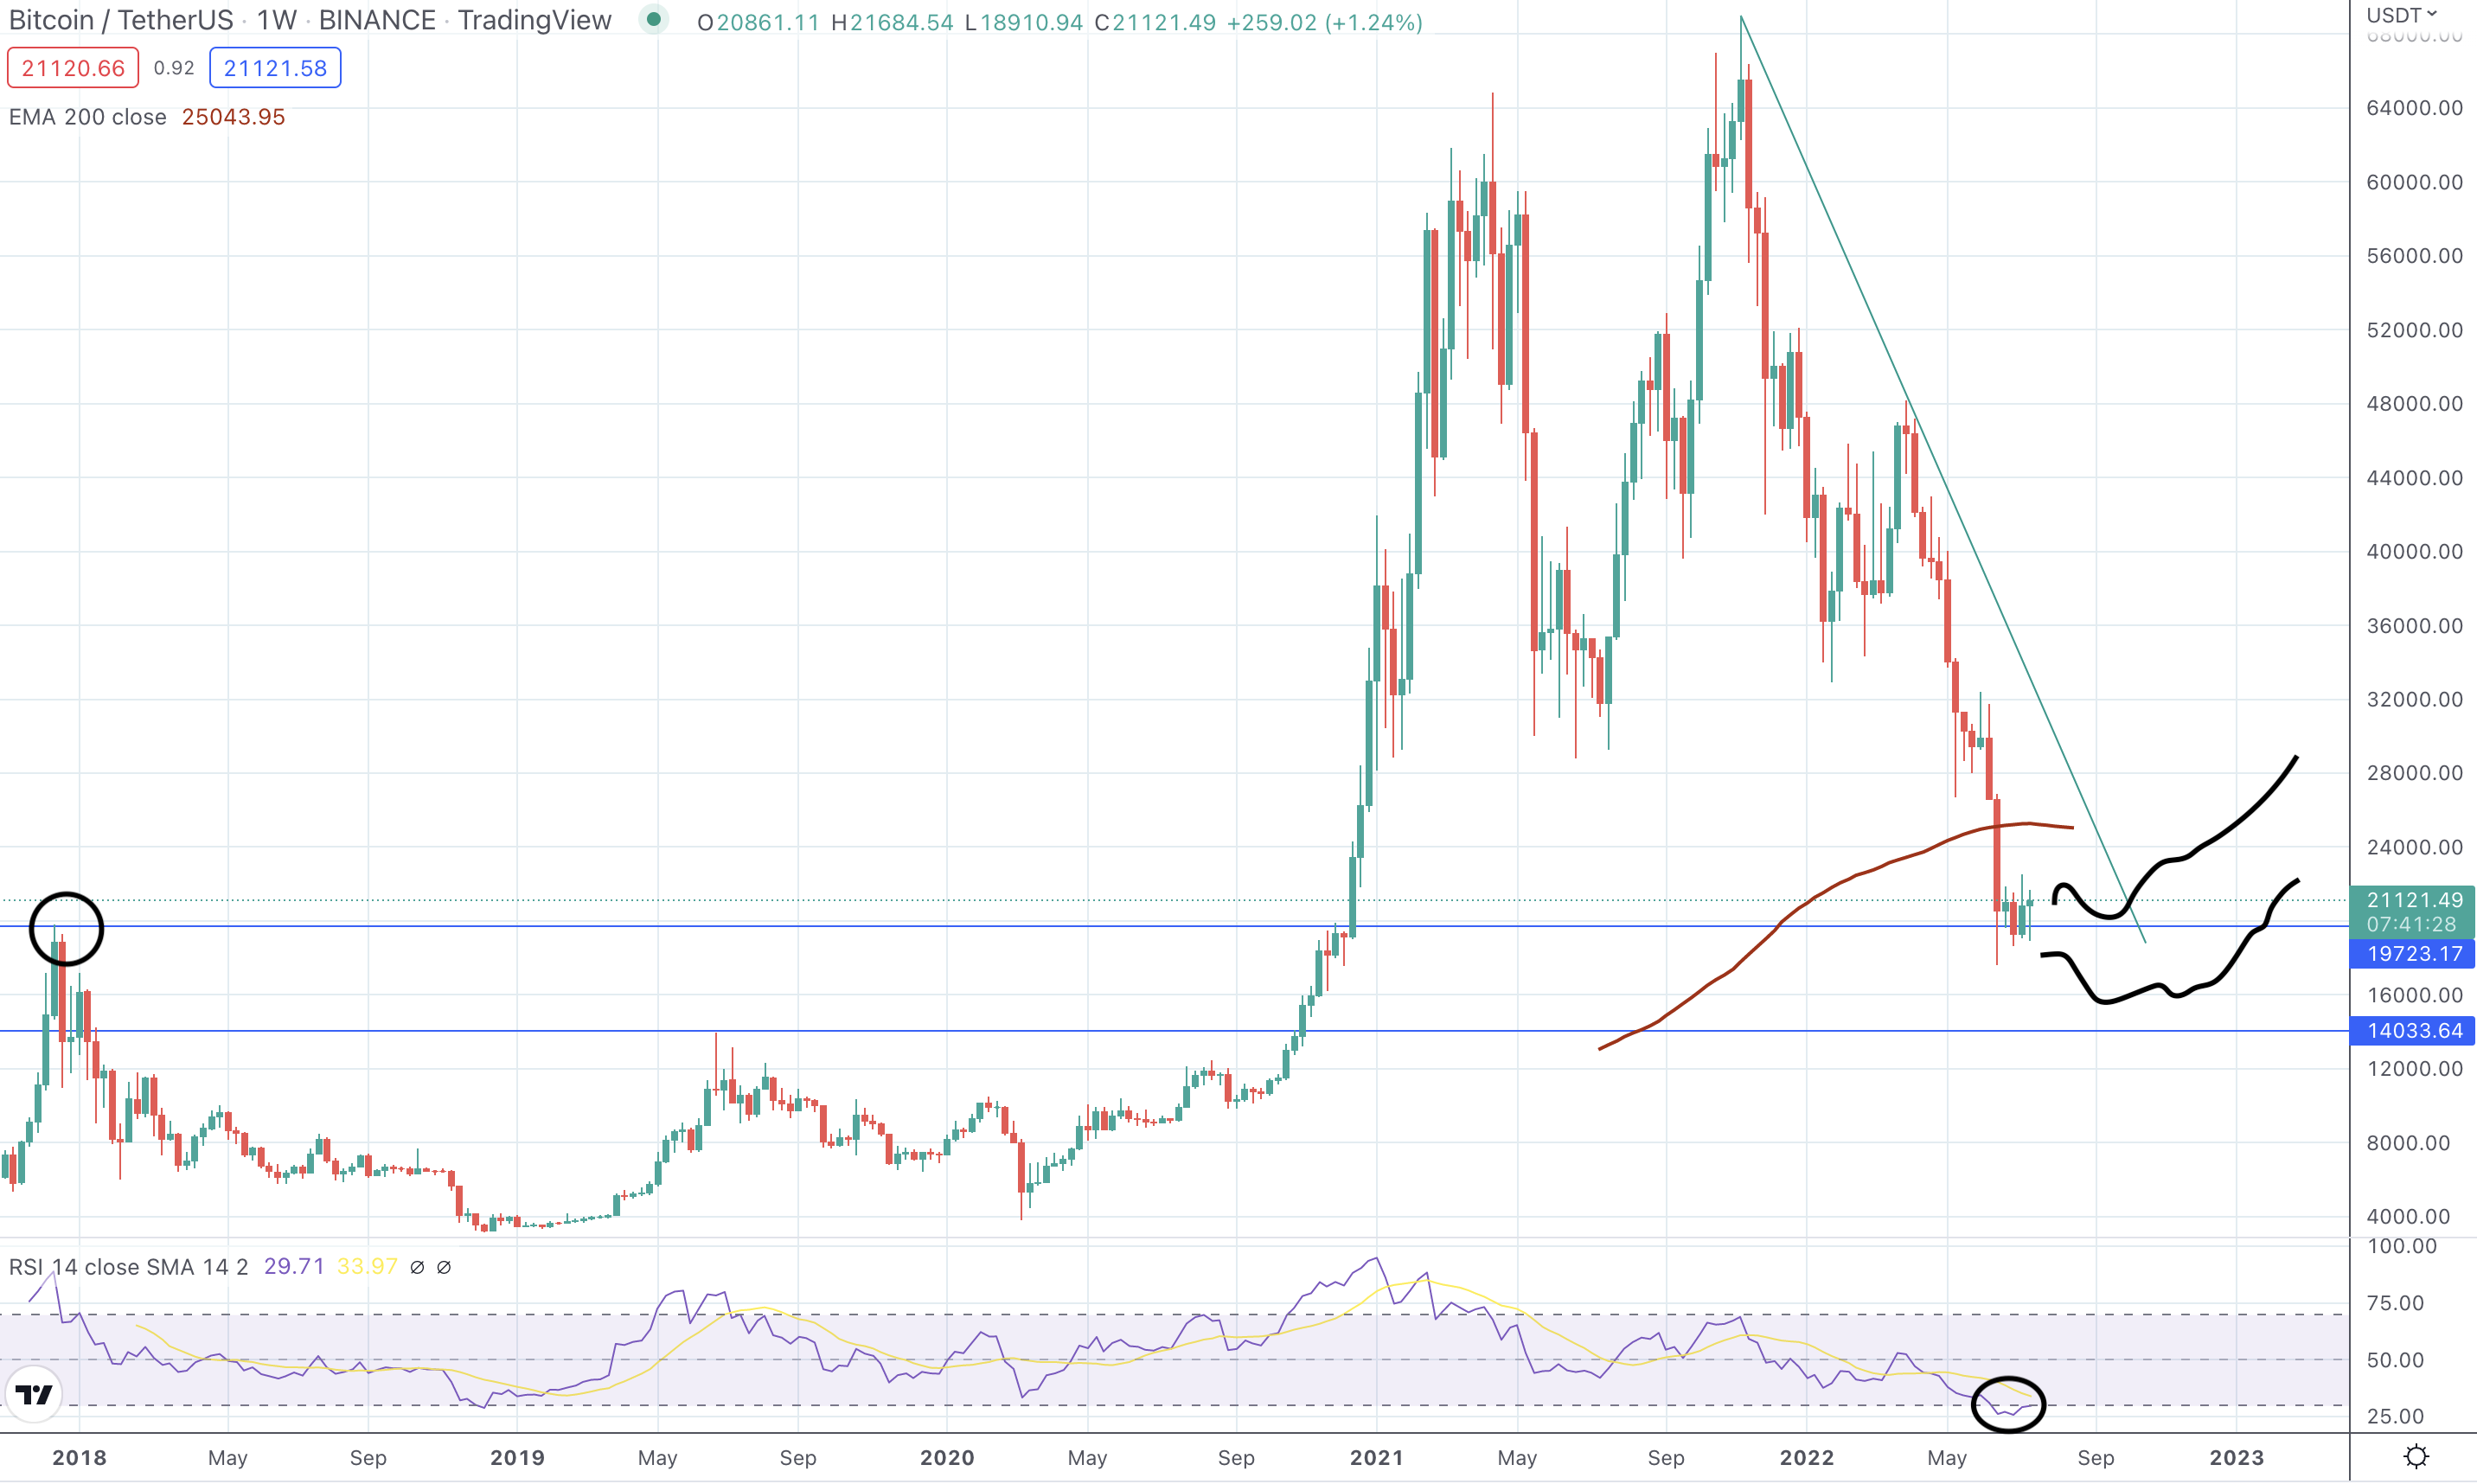
Bitcoin weekly chart, source: tradingview
After BTC got to $20,000 for the first time in 2017, it crashed to $3,000 the next year. Bitcoin did not get below $3,000 since then and probably never will. The same thing happened in 2013. Nevertheless, this financial turmoil caused Bitcoin to crash a little below its ATH from 2017. This is the first time it has happened in history, and it raises an important question: whether it’s a fire sale signal or a red flag.
When we look at Bitcoin from a technical perspective, the $20,000 is strong support, and RSI (on the weekly chart) is even more oversold than it was in late 2018. Back then, the price crashed by more than 80%, while now it fell by around 75% from its ATH.
From a daily timeframe perspective, there is a consolidation like in May this year, but it does not mean the same has to happen again. While it would not be surprising for Bitcoin to go below the $17,500 support again, it is very probable it will not stay down for too long. Although there is a raging crisis in financial markets at the moment, a particular correction is expected, mainly in crypto markets.
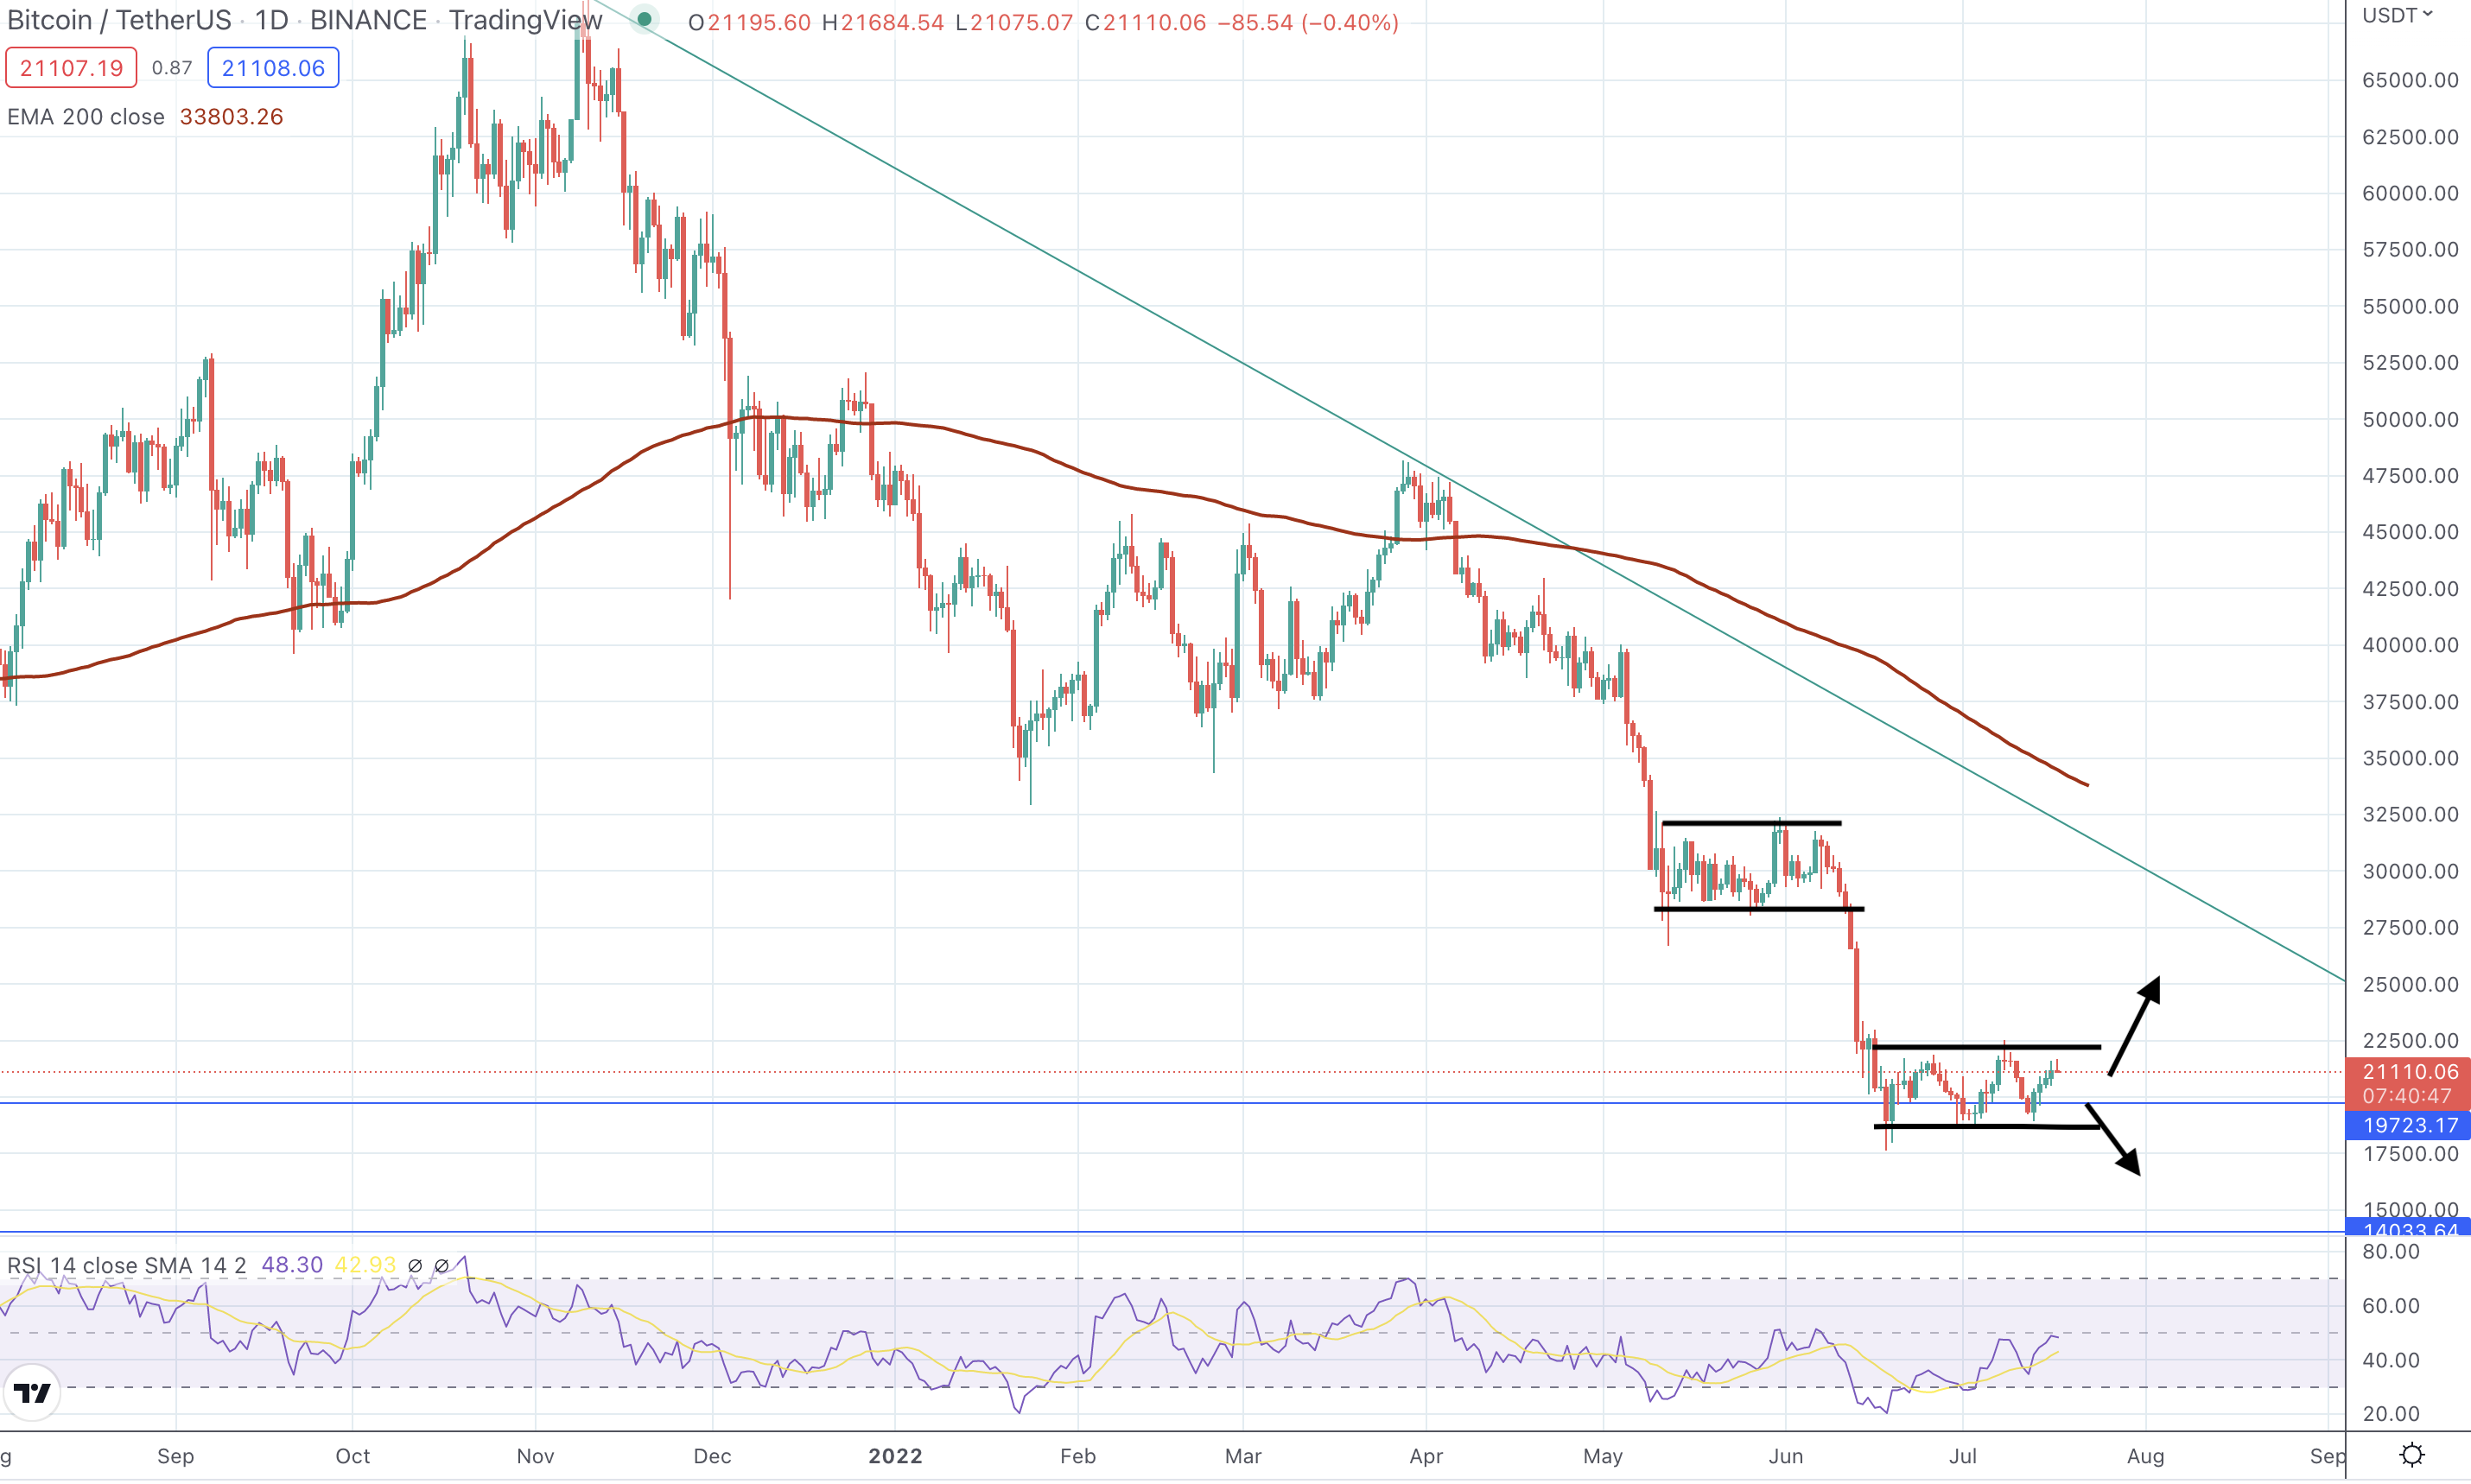
Bitcoin daily chart, source: tradingview
2. It’s basically a fire sale
When it comes to technical and historical data analysis, it is handy to look at the famous Rainbow chart that adjusts exponential price movements and shows where markets could go in the future. You can even see the price explosion after every mentioned halving of Bitcoin.
You may also read: Celsius has announced Chapter 11 bankruptcy proceedings
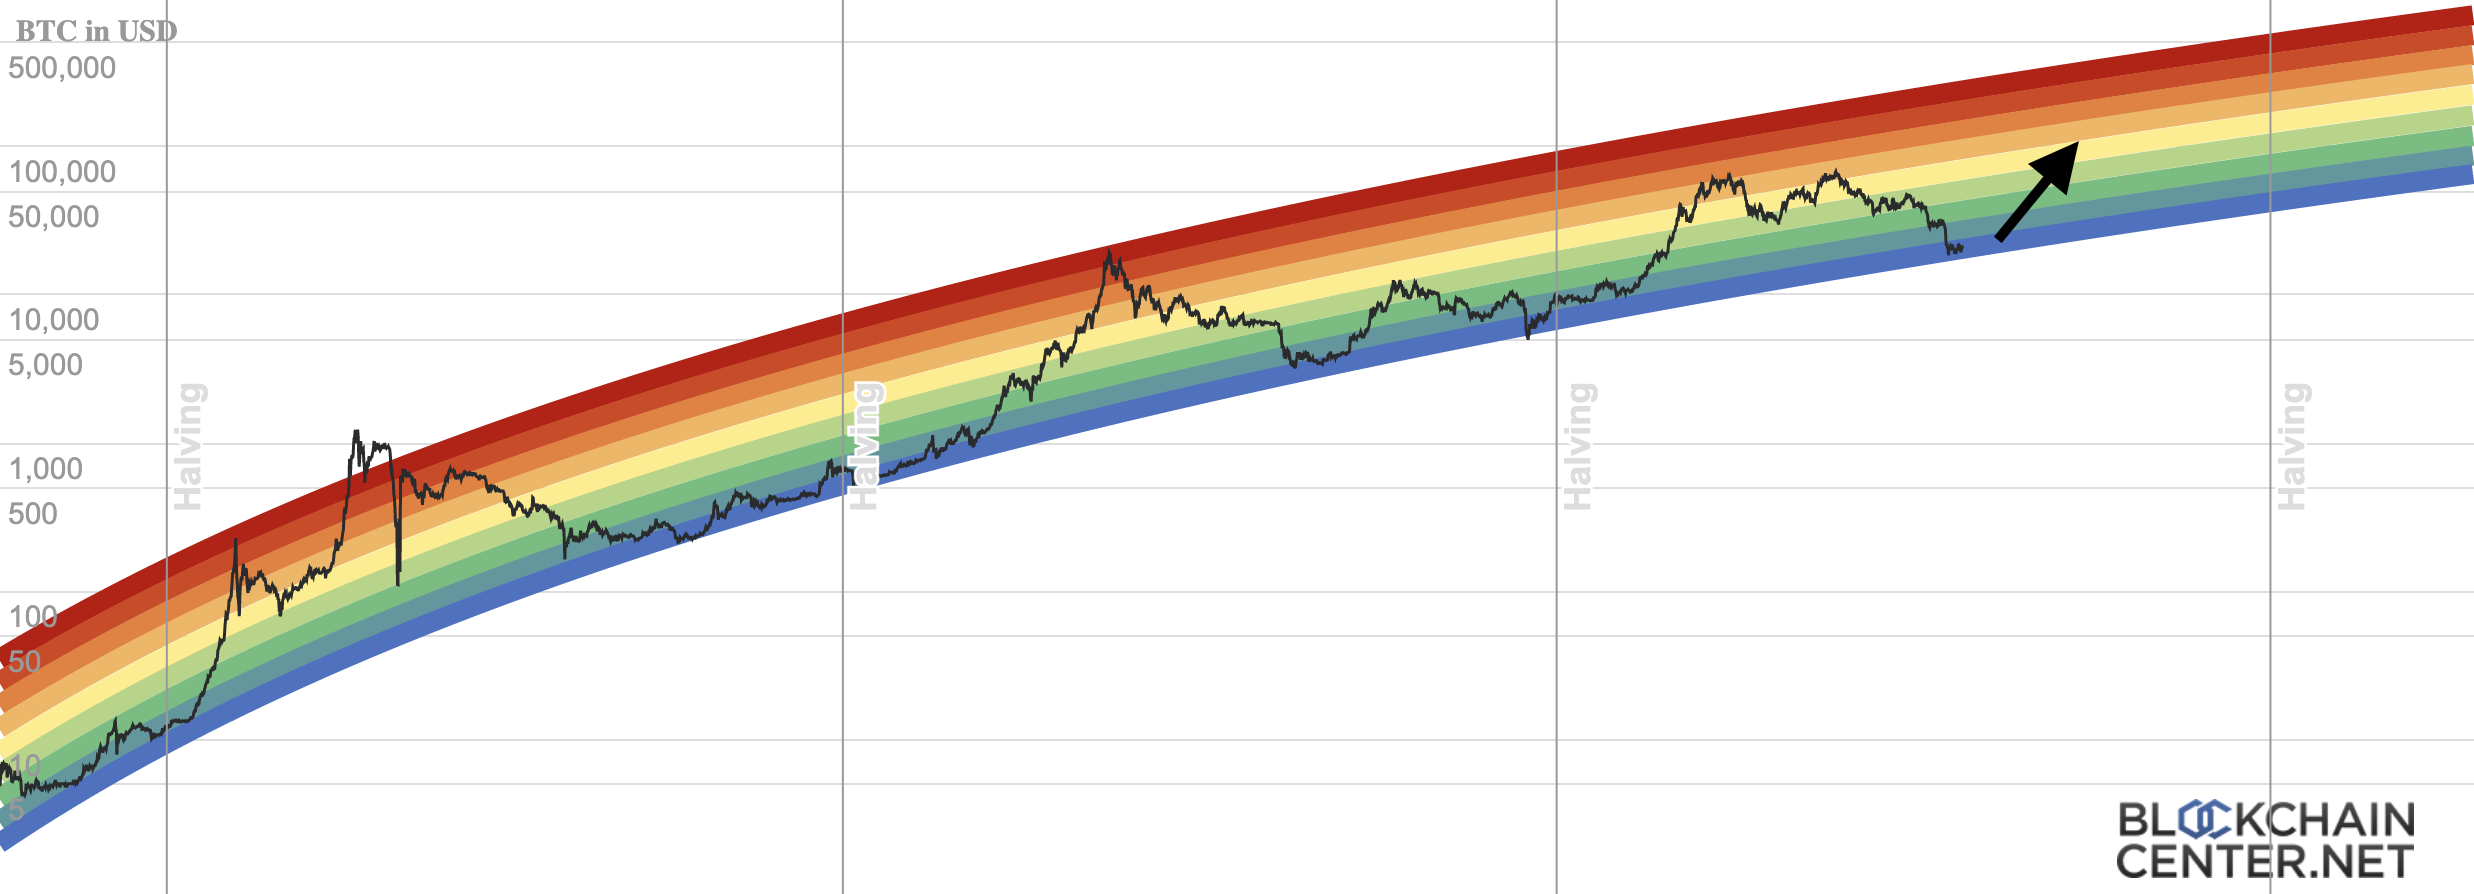
Rainbow chart, source: blockchaincenter
When the price gets to the red & orange territory, it means it is time to sell. When the price of Bitcoin gets to the green & blue zone, it is a buy signal. Currently, it is basically a fire sale signal. BTC is at the lowest area of the Rainbow chart, and while it may fall below the Rainbow for a short while, it is a solid buy signal that many investors will probably follow.
3. Fear & Greed index ready to turn around
The Fear & Greed index is a helpful indicator of when to buy and sell that may be combined with the Rainbow chart. For several months, it displayed strong fear among investors who either panic sold or are afraid to buy cryptocurrencies. Now it is finally showing some bounce, and investors are slowly but surely entering the markets again.
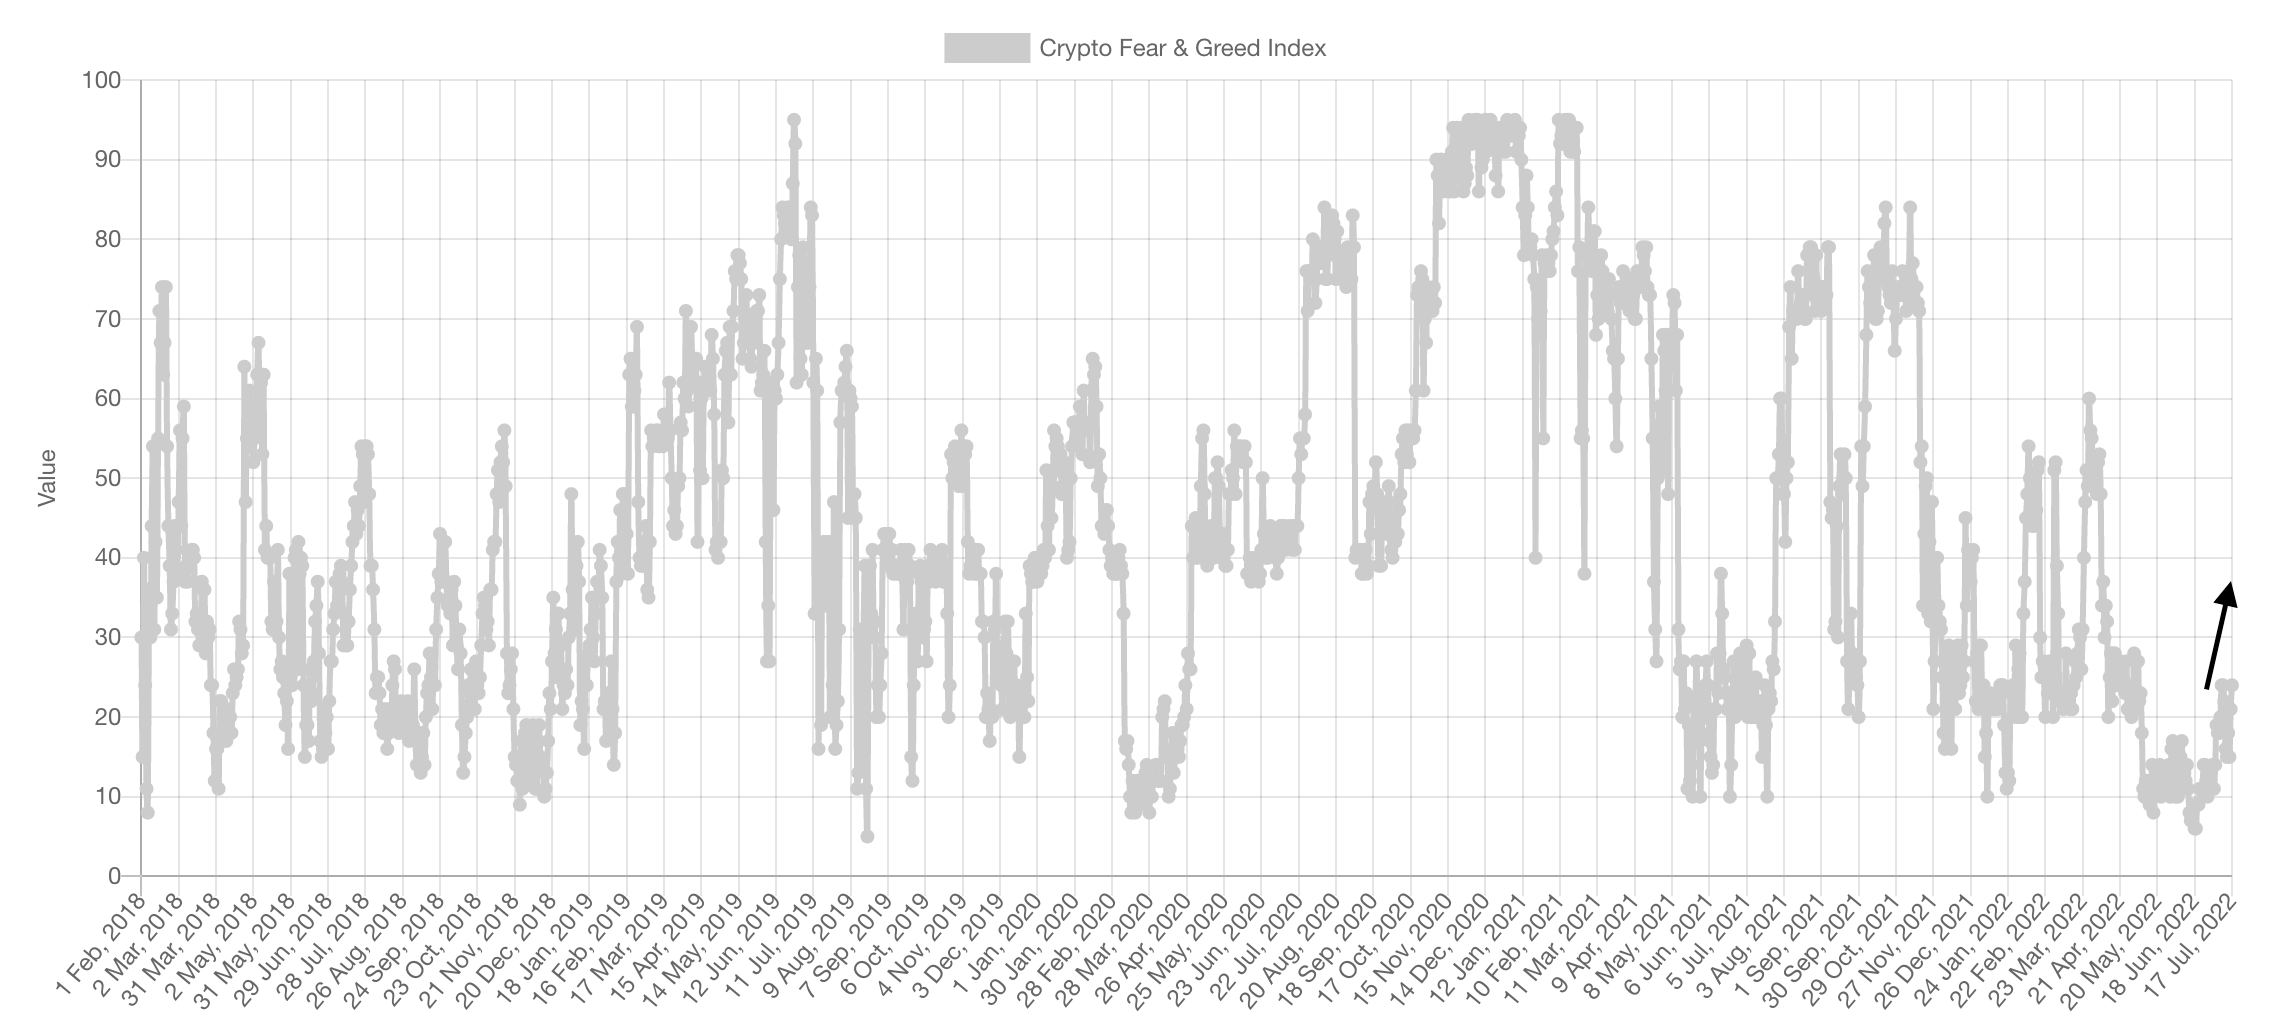
Fear & Greed index, source: alternative
While markets could fall even more in the short-term, many investors and traders now expect markets to turn around. A lot of bad news like bankruptcies of crypto lending firms have probably been priced in, and relief rallies are highly likely to happen.
Conclusion
When investing in crypto markets, it is essential to look at several indicators that have been tested by history. Basic technical analysis, Rainbow chart, and Fear & Greed index are well-proven indicators that show it is the right time to buy long-term. What do you think?


BTC to 30-40k next year easy!