Today, we are concentrating our sight on Norwegian Cruise Line Holdings Ltd. (NCLH), which peaked our interest in 2020 following a major price decline. Currently, the stock price is down more than 75% from its all-time high, but we believe that the company’s business model could struggle within the next one to three years, resulting in additional pain. However, the market capitalization is only down 55% from its all-time high, indicating that Norwegian Cruise did extensive stock dilution to pay its obligations.
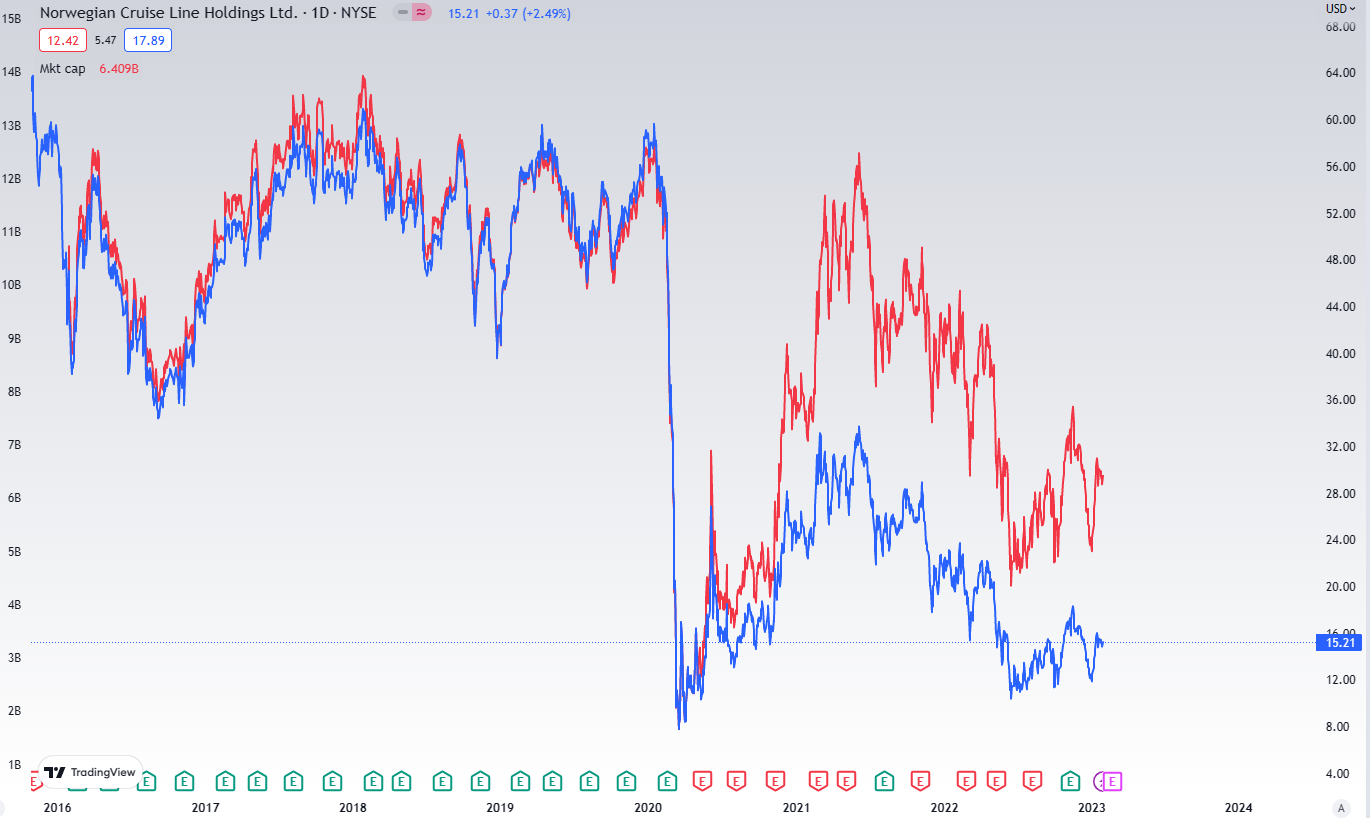
NCLH´s stock price and market capitalization, source: tradingview.com, author’s analysis
It helped to diminish the shareholder value. In addition, the company’s Enterprise Value is approaching its all-time high at $19 billion due to a substantial increase in loaded debt over the past two years, despite the fact that it has not generated any cash from operations. The stock price may not recover in the following one to two years, despite rising revenues and EBITDA, if the balance sheet is in poor shape. The equity is decreasing quarter after quarter. Let’s dive in.
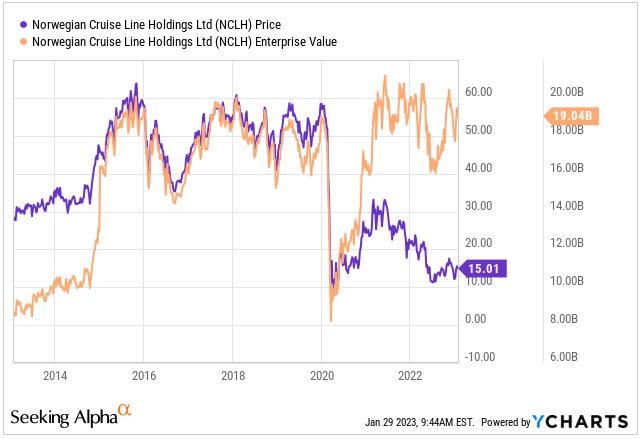
NCLH´s stock price and Enterprise Value, source: YCHARTS, author’s analysis
Business model & macro overview of Norwegian Cruise
Business model overview
Norwegian Cruise is a global cruise company that operates under the brands Norwegian Cruise Line, Oceania Cruises, and Regent Seven Seas Cruises. The company’s business model is based on the provision of cruise vacation experiences to customers. This includes the operation of cruise ships, the sale of cruise vacations, and the provision of various onboard amenities and services.
The key determinants of the company’s business model include factors such as consumer demand for cruise vacations, the availability and cost of fuel, and the company’s ability to effectively market and sell its cruise vacation offerings. Additionally, the company’s financial performance is also influenced by macroeconomic factors such as the overall state of the global economy and the strength of the U.S. dollar. The company’s success in this regard is heavily dependent on a number of factors, including consumer demand, fuel costs, and its ability to effectively market and sell its products and services.
COVID-19 altered the business model
NCLH and other cruise lines were forced to suspend operations for several months due to the pandemic. This resulted in not only a loss of revenue, but also significant costs associated with the cessation of operations, such as the ongoing costs of maintaining the company’s fleet of ships.
We took a deep breakdown of Tesla year-end results as well: Three reasons to be bullish on Tesla
In addition to these financial effects, the pandemic has compelled NCLH and other cruise lines to revaluate and modify their business models and operations to better protect the health and safety of passengers and crew. This has included the implementation of new health and safety protocols, such as improved cleaning and disinfection procedures, as well as COVID-19 testing and vaccination requirements for passengers and crew.
In summary, the COVID-19 pandemic has had a significant negative impact on both the financial performance and operations of NCLH. Significant changes to the company’s business model and operations have been necessitated by the company’s need to adapt to the new reality of the pandemic.
In 2019, the cruiser business model has changed significantly. Due to the stringent regulatory environment in 2020-2021, it was basically unable to make worldwide journeys, and if it did, it did so with a great deal of restrictions that did not suit every consumer. During this time period, Norwegian Cruise incurred a substantial amount of debt, reduced CAPEX, yet must continue to meet industry requirements despite the debt load. It is difficult to maintain a business model when the revenues of an asset-heavy company cease to exist owing to a big disruption. The COVID-19 problem remains, although the regulatory environment has become less stringent.
Another stock analysis you may like: Stock Research: ZIM – a new hidden gem?
In addition, we anticipate strong economic headwinds in 2022 as a result of soaring inflation and the Federal Reserve’s deployment of several instruments, such as rate hikes and quantitative tightening, to combat it. According to a few macro measures, such as The Conference Board’s Leading Economic Index, which signalled a recession a few months ago and continued to deepen in December, the current economic downturn began a few months ago and has continued to worsen. The record of LEI in predicting recessions is exemplary.
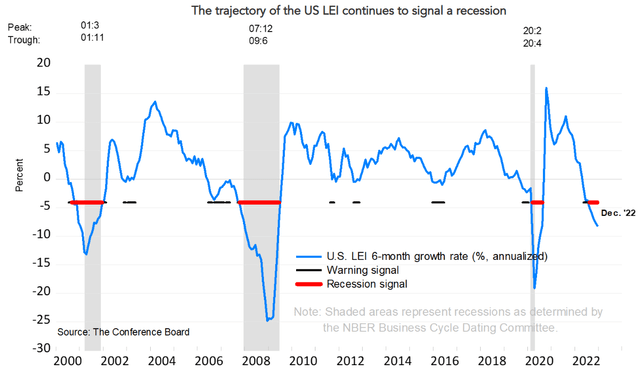
Leading Economic Index, source: The Conference Board
Forward revenues, EPS and EBITDA projection
Whether or not the recession occurs, the conditions are unfavourable for such a business model, as the possibility of an economic recession or downturn could reduce consumer spending. Everyone is cautious despite the fact that EPS are often low during recessions (shadow areas) since consumer spending tends to decline dramatically. However, cruisers’ EPS are objectively down and still in the red, but this is expected to improve according to estimates and revision trend. However, every time the company’s competitors were in crisis mode (due to recessions), the company’s EPS decreased.
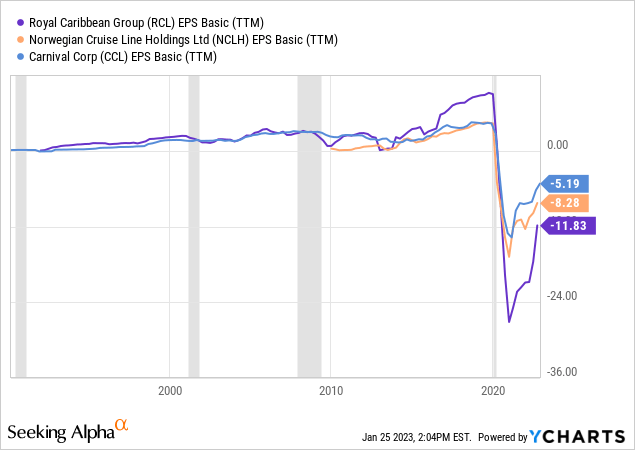
The competitors EPS in recessions, source: YCHARTS, author’s analysis
Consensus revenue revision trend for FY 2022 ($4.8 billion), FY 2023 ($8.53 billion), and FY 2024 is shown below, based on the most recent projections ($9.3 billion). In 2019, net sales totalled $6.46 billion, although both projections for FY 2023/2024 are significantly higher than 2019’s peak.
However, based on 3Q2022 filling of Norwegian Cruise:
Booking trends for full year 2023 remain positive with cumulative booked position equal to record 2019 levels inclusive of the company’s increase in capacity. Pricing is higher than that of 2019 at a similar point in time for full year 2023. Net booking volumes continue to be at the pace needed to reach historical occupancy percentage levels in 2023; however, our full fleet may not achieve historical occupancy levels on our expected schedule and as a result, current booking data may not be informative.
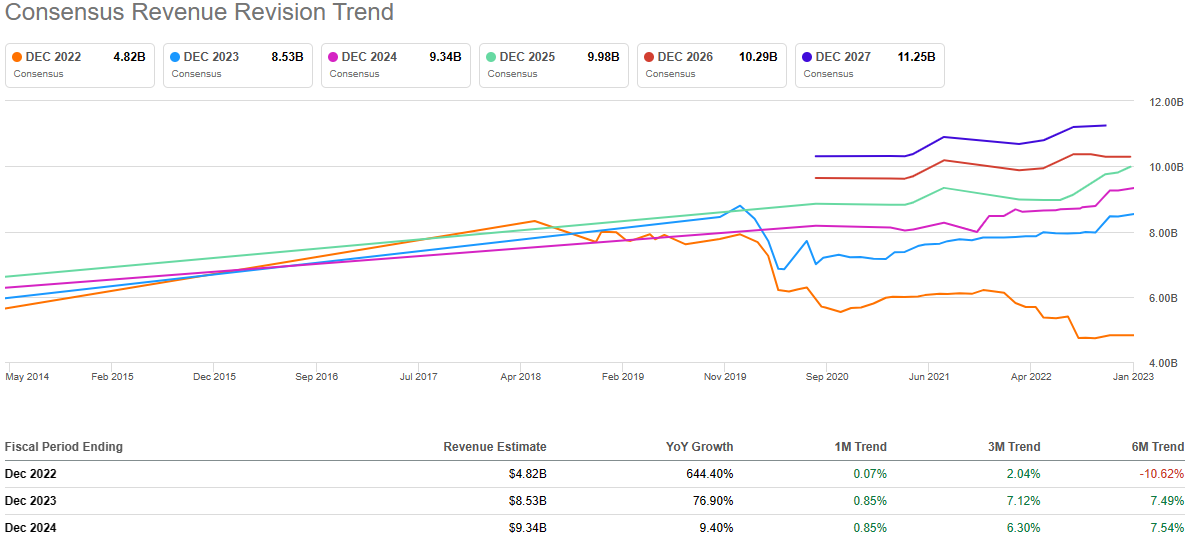
Norwegian Cruise – consensus revenue revision trend, Source: Seeking Alpha
However, the median forecasts do not take into account the possibility of a recession or a simple interruption caused by a decrease in consumer expenditure. Based on the above-mentioned filings, the management anticipates a better year in terms of revenue than in 2019, but is far more conservative than the street projection.
According to FORM 8-K:
As of December 31st, 2022, our cumulative booked position was approximately 62% for full year 2023, in line with previously outlined expectations, and at higher prices than 2019 at a similar point in time. Fourth quarter occupancy was approximately 87%, with the gap versus 2019 levels continuing to narrow sequentially. We are also experiencing strong and broad-based onboard revenue generation even as occupancy increases.
Without stock dilution or the issuance of new debt, we are convinced that the company could have material debt repayment issues. For this purpose, we must estimate forward EBITDA and then examine maturing debt in 2023 and 2024 (with interest) to determine if there is sufficient EBITDA generated to cover bank liabilities. It is known as DSCR.
DSCR
The Debt Service Coverage Ratio (DSCR) is a financial metric that measures a company’s ability to generate sufficient cash flow to cover its debt service obligations. It is determined by dividing the net operating income or EBITDA of a company by its total debt service. A DSCR ratio of at least 1.0 indicates that a company generates sufficient income to cover its debt service and is deemed financially healthy. A ratio below 1.0 indicates that a company’s income is insufficient to cover its debt service and that it may be at risk of loan default.
In the graph below, you can see the analysts’ projected EBITDA for the next fiscal year ($2.29 billion) and the two fiscal years ahead ($2.32 billion).
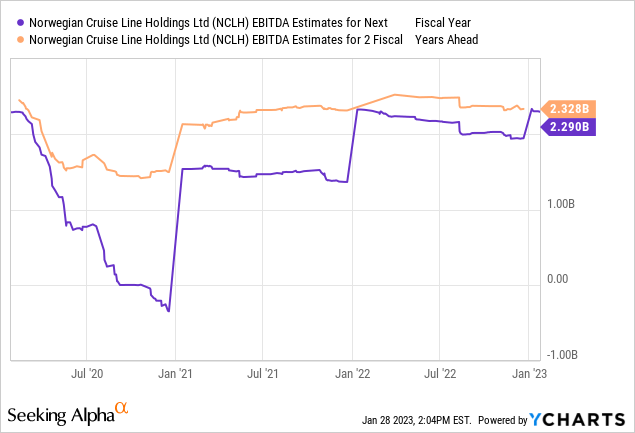
NCLH estimated EBITDA (next FY and 2 FY ahead), source: YCHARTS, author’s analysis
Estimating EBITDA and DSCR
We will also attempt to examine our projections, which are based on historical data for each P&L item. For future net sales (in 2023 and 2024), we will utilize SA’s projections, as seen above. In the table below, you can see our personal forecast, but there are also two alternative scenarios:
- In the first scenario, we used SA’s median sales projections for FY 2023 and FY 2024 and then calculated EBITDA using the most objective inputs.
- In the second scenario, we also calculated total revenues, which we believe will be lower than consensus estimates and closer to SA’s bottom net sales projections. As we believe we have applied the most objective values to calculate COGS and OPEX, with the same structure of costs in percentage (% of revenue) as in the first scenario.
In case of assumptions, we accounted for slightly higher COGS as a percentage of revenues in 2023, as well as higher SG&A expenses, as a result of higher inflation in 2021 and 2022, which should result in higher prices. We are confident that these assumptions for 2023 are neutral to slightly optimistic, as fuel prices (one of the key items) remain significantly higher than its 2019 peak.
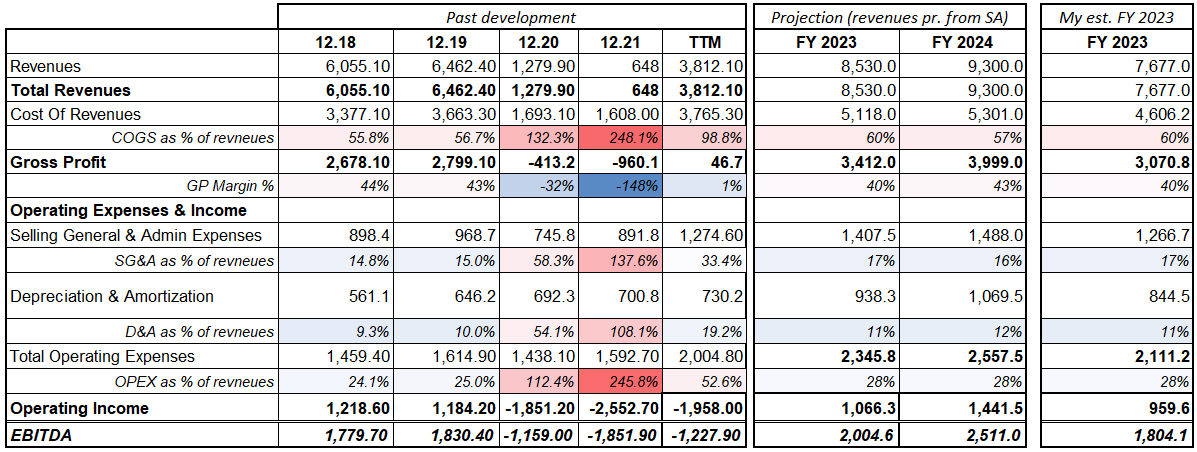
NCLH EBITDA projections (two scenarios), source: author’s analysis
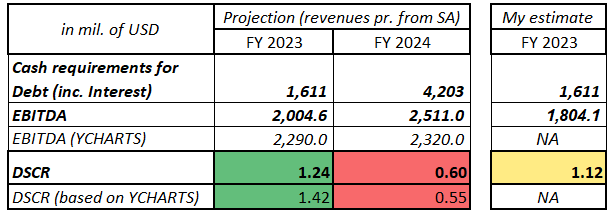
However, EBITDA should reach a record high of $2.0 billion in FY 2023 and $2.5 billion in FY 2024. In our scenario, it would be at $1.8 billion, so the result would be slightly below 2019’s peak levels. All of these assumptions are based on the premise that a recession will not occur in 2023. However, bear in mind, that such risk still exists.
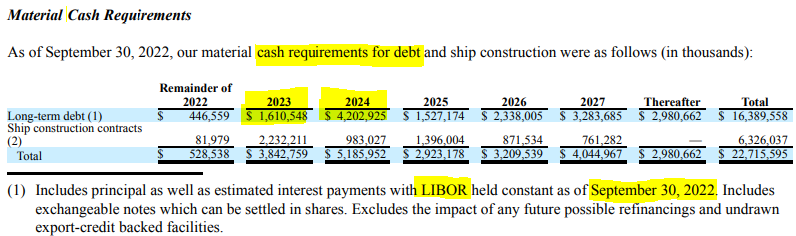
In the table below from the quarterly report, long-term debt cash requirements (debt repayments and estimated interest) to creditors are described (banks, financial institutions). For FY 2023, it will be $1,611 million, and for FY 2024, it will be $4,203 million. This is the minimum EBITDA required for sufficient debt service.
Cash requirements for debt service, Source: NCLH fillings
However, according to SA news:
NCL Corporation, a subsidiary of Norwegian Cruise Line Holdings has priced $600.0M aggregate principal amount of its 8.375% senior secured notes due 2028. Net proceeds from the offering will be used to repay a portion of the term loans outstanding under senior secured credit facility that will become due in January 2024, including to pay any accrued and unpaid interest thereon, as well as related premiums, fees and expenses.
This print will result in a decrease in outstanding debt and cash requirements for debt in 2024, but an increase in cash requirements for 2023, 2025-2028. All of these requirements may increase because interest is calculated via LIBOR, typically the monthly LIBOR rate. As evidenced by the chart below, monthly grew substantially since September.
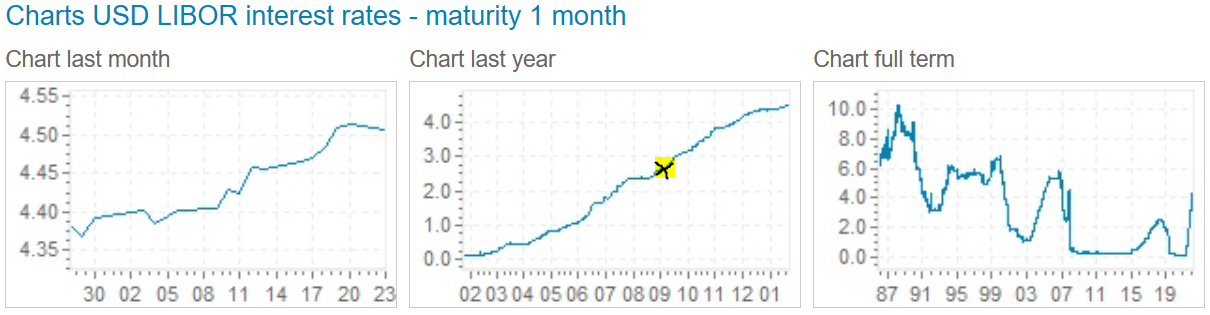
USD LIBOR interest rates with 1 month maturity, source: global-rates.com
Therefore, the minimum EBITDA will almost certainly need to be higher in order to cover its debt obligations. However, let’s examine a few optimistic assumptions regarding our key variables from the most recent quarterly filing. Regarding the fiscal year 2023, the DSCR should be between 1.12 and 1.24 (depending on the first or second scenario), but there is considerable downside risk as follows:
- The addition of new debt will increase cash requirements for FY 2023,
- higher LIBOR rates will increase the cash needed due to increase of interest.
And finally, DSCR in FY 2024 is in a very risky zone for lenders (but also for management due to leverage), which is another reason why the company has had a tendency to repay a portion of its debt (or partially refinance its maturing debt in 2024) with fresh $600 million senior notes due in 2028.
NCLH, DSCR and EBITDA projections, source: author’s analysis
As previously said, there is a substantial possibility that DSCR (the main metric for banks and institutions) may go below 1.0, and even if this does not occur, the situation is still unsatisfactory. Despite the potential for record EBITDA in 2023 and 2024, there is a very considerable risk that investors will experience additional shareholder dilution or the emission of additional debt. So the balance sheet should be still under the pressure. Let’s determine the extent.
Ruined balance sheet
First and foremost, it is essential to assess the working capital, which is the difference between current liabilities and current assets. In absolute terms, the current assets (consisting primarily of cash) began to decline dramatically in 2020, as the corporation began to burn cash due to low sales and cash generation in 2020-2022 (due to to strict COVID-19 restrictions and limited operating activities). The growth in CA in 2020-2021 has been driven primarily by the cash from long-term debt and not by significant cash flows from operations.
Read more: Peloton skyrockets after the earnings report, touches 8-mth highs
Current liabilities declined in 2020 and 2021 as a result of the company’s ability to convert short-term debt into long-term debt under favorable terms. As time progressed, the approaching due dates of long-term liabilities (debt) caused them to transition into short-term liabilities, resulting in an increase in CL. As due dates approach, CL will climb considerably unless the corporation refinances it with long-term debt, as we saw in the example of new debt ($600 mil.). This procedure will continue until the company has positive working capital figures or substantial cash flow from the core company operations.
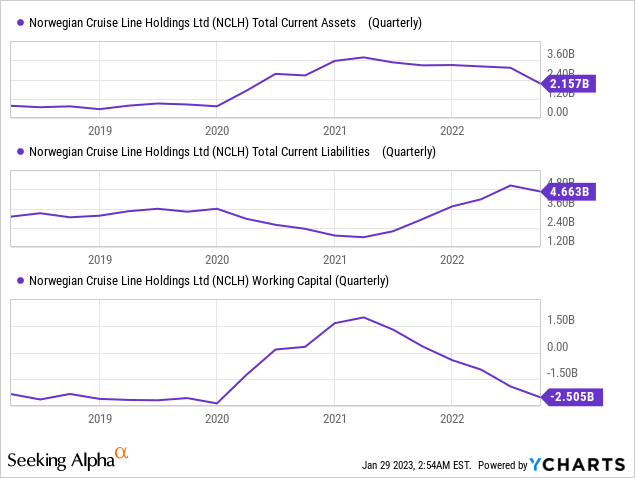
NCLH, current assets, current liabilities and working capital, source: YCHARTS, author’s analysis
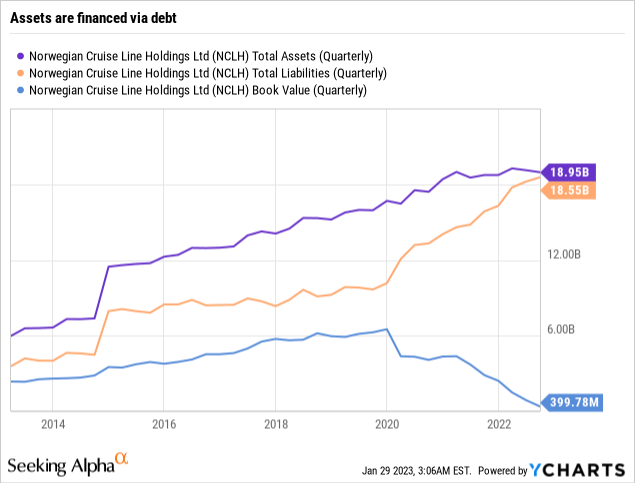
In the graph below, we can observe how, after 2019, the trend of the balance sheet has shifted to an unhealthy business with many hurdles (due to objective factors). While until 2019 the assets had been partially financed by debt, but the book value had also improved substantially, beginning in 2020 the assets started to be financed solely by debt or liabilities, with equity funding declining significantly quarter over quarter. Negative net income in 2020-2022 and maybe in the first quarter of 2023 is reducing the book value (or equity), as we mentioned in the previous quotations from the company.
The erosion of book value is extremely critical, because it is the reason why the business model is so unhealthy. The anticipation of positive EPS in 2023 and ensuing years should cause the equity to start to climb, albeit very marginally. However, if we were to experience a recession, the EPS may be very optimistic as the consensus predicts, and the balance sheet would be in an extremely precarious situation to take on more debt. Due to poor balance sheets, many companies in the industry could go bankrupt if the recession scenario plays true.
NCLH – assets, liabilities and equity, source: YCHARTS, author’s analysis
Looking at the liquidity ratios, the quick and current ratios are reaching uncomfortable levels, but this could be mitigated by the expectation of future cash flow in 2023. On the other hand, liquidity ratios are still above 2019 levels, but there is much more uncertainty in 2023 and 2024, so we would welcome higher ratios to be more comfortable with the liquidity.
In the case of financial leverage, debt to equity reached a stunning 2.9, which is absolutely dissatisfactory, as well as debt to assets, which reached 73%. In other words, 73% of all assets are being financed via debt. Such ratios are extremely dangerous in the medium- and long-term, and looking ahead to a solid degree of uncertainty about the economic cycle in 2023, we consider these ratios to be very unhealthy.
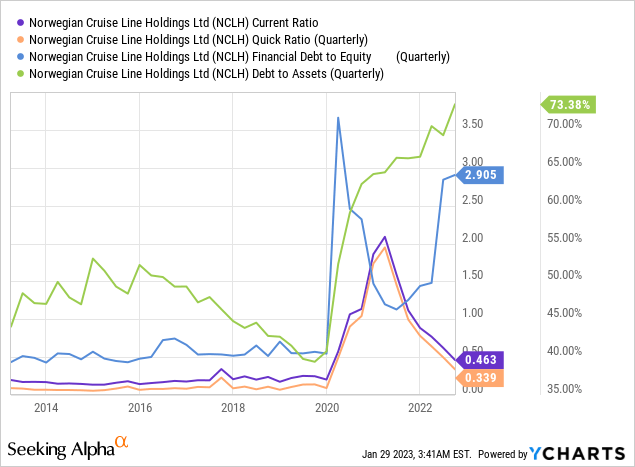
NCLH – financial leverage, source: YCHARTS, author’s analysis
Summary, valuation and risks
Due to the considerable volatility of its revenues, EBITDA, and earnings from operations, calculating forward Free Cash Flow for such a corporation is a difficult task. With a score of D, the SA evaluation tool is very effective from this perspective. We perceive it in a similar light.
In the past two years, both book value per share and shareholders’ equity have vanished. In other words, price to book value is reaching record 15.8 due to huge drop on the equity side. Book Value per share is well under $1. Due to the company’s expectation of higher net income and EBITDA in 2023 and 2024, we do not believe that this is a fair price. However, it is now extremely difficult to assess with precision because so many variables are unknown. Nonetheless, even if the firm was significantly undervalued, we would not be bullish, because of its extremely weak financial sheet.
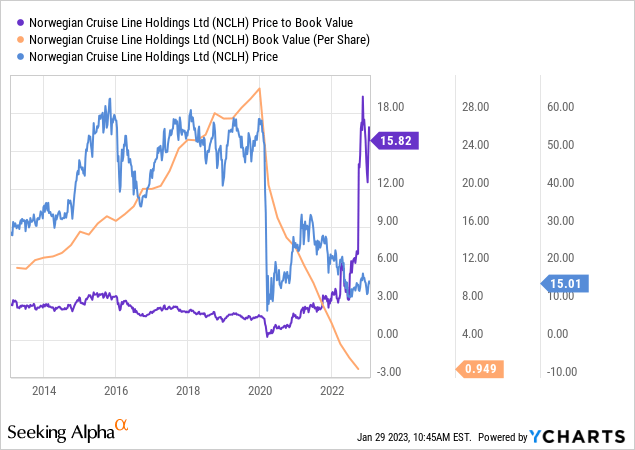
NCLH – Book value per share and P/B, source: YCHARTS, author’s analysis
Norwegian Cruise Line should become profitable in FY 2023 and FY 2024, quite apart from the company’s dismal prognosis for the first quarter of FY 2023. This is an encouraging indicator. The company has approximately 62% booked full capacity. Nonetheless, even if the company is able to achieve analyst-predicted sales records in 2023 and 2024, it would face considerable obstacles in delivering solid EBITDA to satisfy its debt obligations due to its substantial debt load. My guess is even more modest.
Rather than a larger EBITDA margin, increased LIBOR rates and new debt pose a greater threat to cash requirements. Such a high predicted EBITDA would be quite satisfactory for EPS, major balance sheet improvement, and investors in normal times. The company has a highly difficult business strategy, and the majority of EBITDA, or free cash flow, will cease due to debt payments with interest.
We would argue that the business is extremely close to entering the restructuring phase. In addition, there is no downside risk priced in sales yet, as the macro environment and overall consumer spending scenario are not very favorable. Due to the global uncertainty, the company’s balance sheet should contain significantly more liquid assets than it does today. From an investor’s perspective, it would be far safer to wait a year and see the company’s development before investing.
Learn more on how to look at the financial ratios: How to analyze the stock market with financial ratios?
Both debt-to-assets and debt-to-equity ratios have reached extremely perilous levels, rendering the balance sheet utterly ruined. Working capital is seriously negative, so short-term liquidity is insufficient. It will only become worse when long-term debt is converted to short-term debt and current liabilities explode.
On the other hand, current assets will not increase much unless the company begins to create more cash. Due to the increased demand for cash requirements to service debt, current assets should continue to decrease. From this perspective, there is still a substantial possibility that the firm could dilute its shares, which would pose a big risk to investors. The alternative possibility is the issuance of fresh debt or the establishment of new loan lines.
Even though the research gave us the result of sell rating, it isn’t tied to short selling. The risk connected with this thesis is the possibility that estimates will be delivered with a significantly larger margin than we currently anticipate. Thus, the company may be able to generate significantly enough EBITDA, net income, and FCF to pay down a substantial portion of its debt – not just for FY 2023, but also with longer maturities. Personally, we would be pleased if this were the case so that the company’s base operations could return to pre-2020 levels, but we suppose it will be an enormous task for the company’s management.
Disclaimer: The fully covered text is not investment or trading advice. It represents only the author’s point of view and thoughts, and we do not bear responsibility for your potential loss. The article serves only for analytical and marketing purposes.


Comments
Post has no comment yet.