Being able to evaluate stocks the right way is hard. Most investors struggle to outperform the market in the long run, with a few exceptions like Warren Buffett. The long-term annual average performance of the S&P 500 index is almost 10%, but it can even rise by 30% like it did in 2021, or fall by 18% like in 2022. So obviously, it’s not about timing the market but about the time in the market.
Markets are very volatile in the short run, but investors who choose to invest for more than 10 years are almost certain to make notable returns. Following financial ratios like P/E, P/B, P/S, etc. could be significantly helpful in determining your possible investments.
Active vs passive investing
If you don’t know these financial ratios, read the article below to fully understand them first. Then we can jump on actual examples of how to apply them. Researching may be tough, but investors should try to do it most effectively. If you invest in stock indices like S&P 500 or Nasdaq, you don’t need to watch out for these kinds of ratios.
Related article: From P/E to P/FCF – 5 financial ratios you need to know
However, if you have or want to build your own stock portfolio, these financial ratios could help you pick the right stocks and beat the benchmark. This is one of the tools Buffett uses to beats stock indices’ performance in the long run. He doesn’t pick 500 stocks for his portfolio, but let’s say approximately 50.
This increases the potential profit as he focuses on winners. So he doesn’t “overdiversify” his portfolio with too many stocks. Instead, Buffett invests in companies with the highest probability of increasing over the long term as he did with Apple.
But financial ratios are not the “holy grail”
The P/E ratio can be used as an indicator of whether a stock is overvalued or undervalued. If you see a high P/E ratio, it might mean that investors think there will be more growth in the future than historical data indicates. But if you see a low P/E ratio and its historical average is higher than current levels, then this could mean that something has changed in their expectations about future performance and thus caused them to re-evaluate their valuation on those shares.
This means that using these ratios is not so plain and requires some reading between the lines. If these ratios are low, it doesn’t necessarily mean you should go ahead and buy the stock. It’s also what investors expect from the company in the future.
So sometimes you may see a stock with a P/E ratio of 100 and think this is too high to buy. However, it may just be misleading as it doesn’t have to mean it’s overvalued. Investors might just expect more growth in the future, that’s all. So if you are about to use these financial ratios, make sure to read between the lines.
Helpful way to dig into a company’s financial data
Financial ratios are a good way to see how a company is doing. For example, if you’re looking at the stock market as an investor, it’s important to know how much debt your favourite companies have taken on. You can also use financial ratios to compare different companies’ performance over time by comparing their total assets with their total liabilities.
This will give you an idea of which businesses have been able to grow faster than others over time. Financial ratios help investors determine whether or not a company’s shares are undervalued or overvalued relative to other similar entities in its industry.
Read more: Building an investment portfolio – 5 easy steps
If one company has higher debt than another while having lower revenue per employee, then it may be considered undervalued because there is less risk associated with owning this stock. Another firm might be considered overvalued because its ability “to pay back” its debts may be limited due to its lacklustre financial performance overall.
How to use financial ratios in investing – examples
Most financial ratios fell during 2022 with the stock prices. So if we look at Meta Platforms (META), for instance, investors are actually willing to pay less for the stock in the future. The P/E is only at 12.91, P/B at 2.93, P/S at 3.0, P/FCF at 13.46, and D/B at just 0.08, presenting very little debt.
These ratios were much higher when the stock was trading near $400. As the stock went through the biggest drop in its existence and ratios are fairly low, it might actually be a good time to buy the stock for the long term. It also failed to fall below $100, a notable psychological number, while being down 66%.
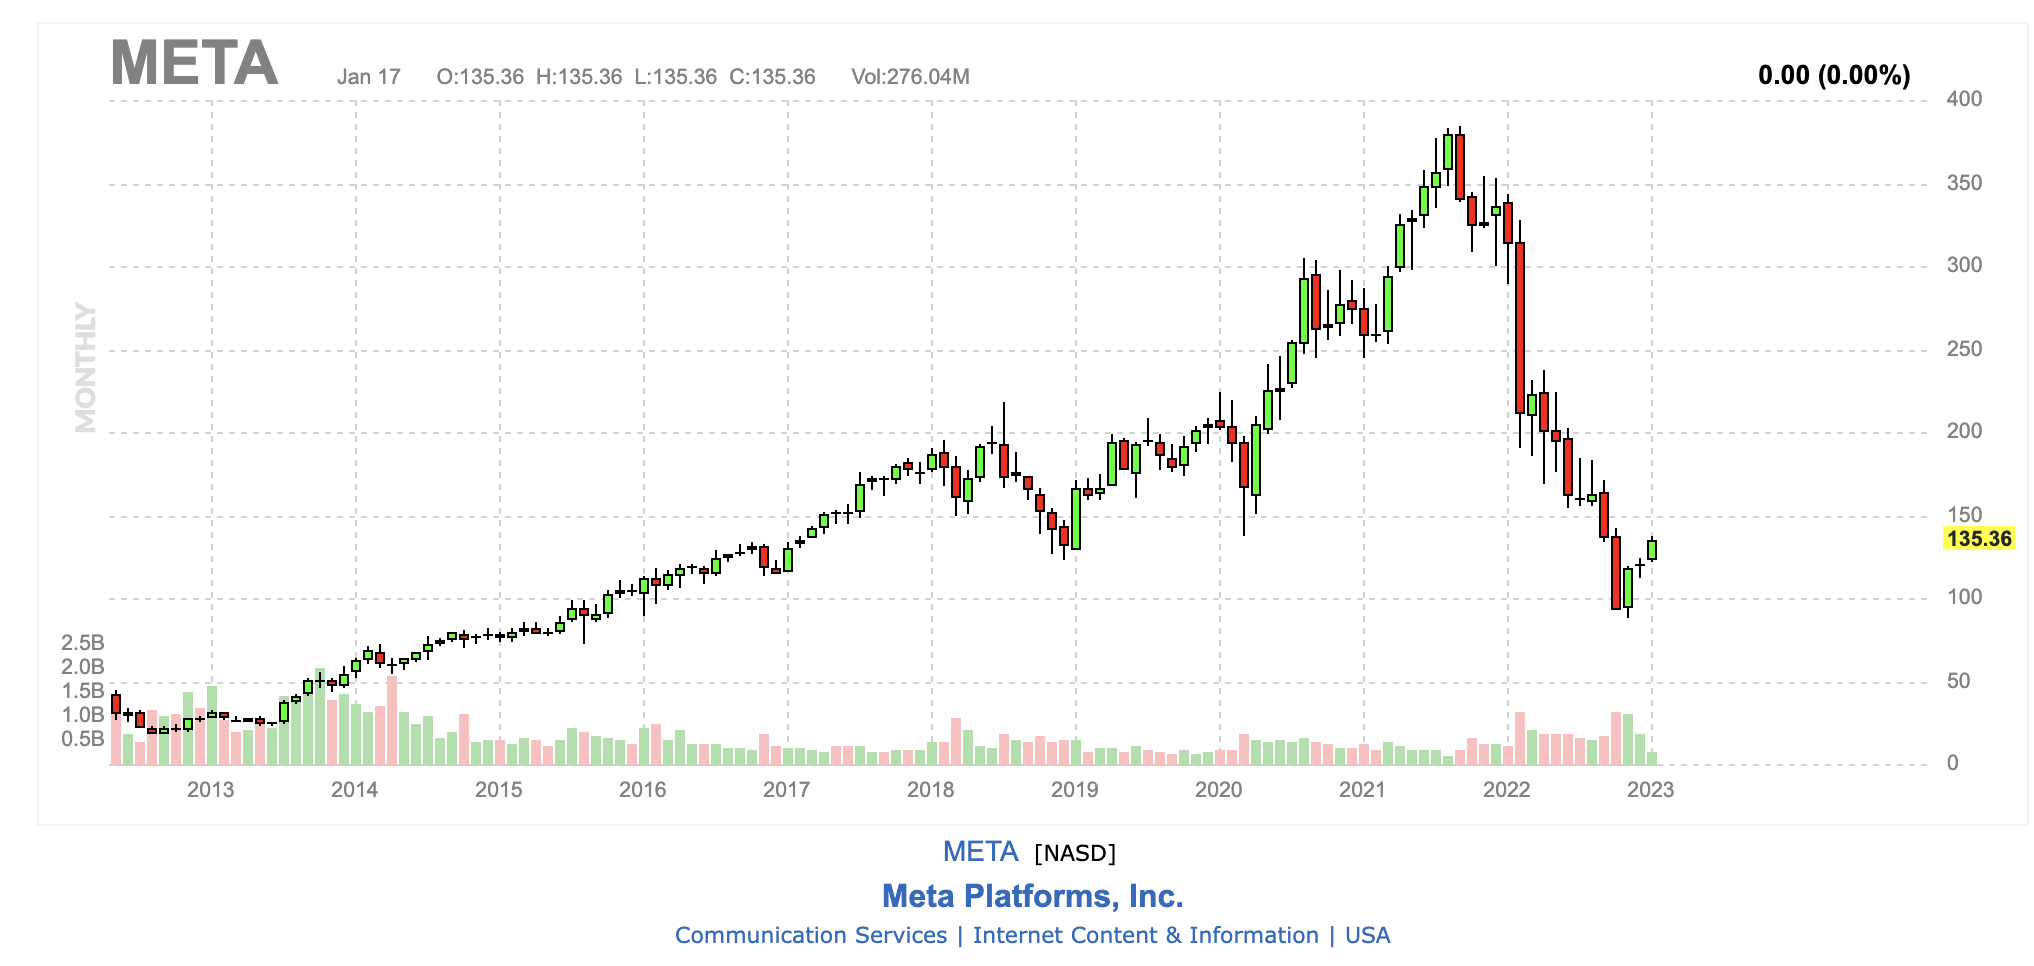
Meta Platforms (META) stock chart, source: finviz.com
There is no one magical number you should specifically look for while analysing financial ratios. It’s about the overall picture. It’s what investors expect versus what will actually happen. The main thing to do to improve your investment decisions is to buy stocks when they fall, not when they rise.
Another thing you could do is dollar-cost average (DCA) over time to avoid timing the market and diversify. This will simply improve your performance overall as the stock market is mostly unpredictable.
Also read: Recession: what is it and how to protect against it?
While most stocks tumbled in 2022, Apple fell by “only” about 32% and has been marked as overvalued for many years. It is difficult to apply financial ratios to the most valuable company in the world, which is almost “too big to fail.” The company’s financial ratios are high for a long time, with P/B at 43, P/FCF at 22.16, and debt-to-equity at 2.37. Apple is a different story. Its global influence and colossal cash reserves make the stock climb higher each year.
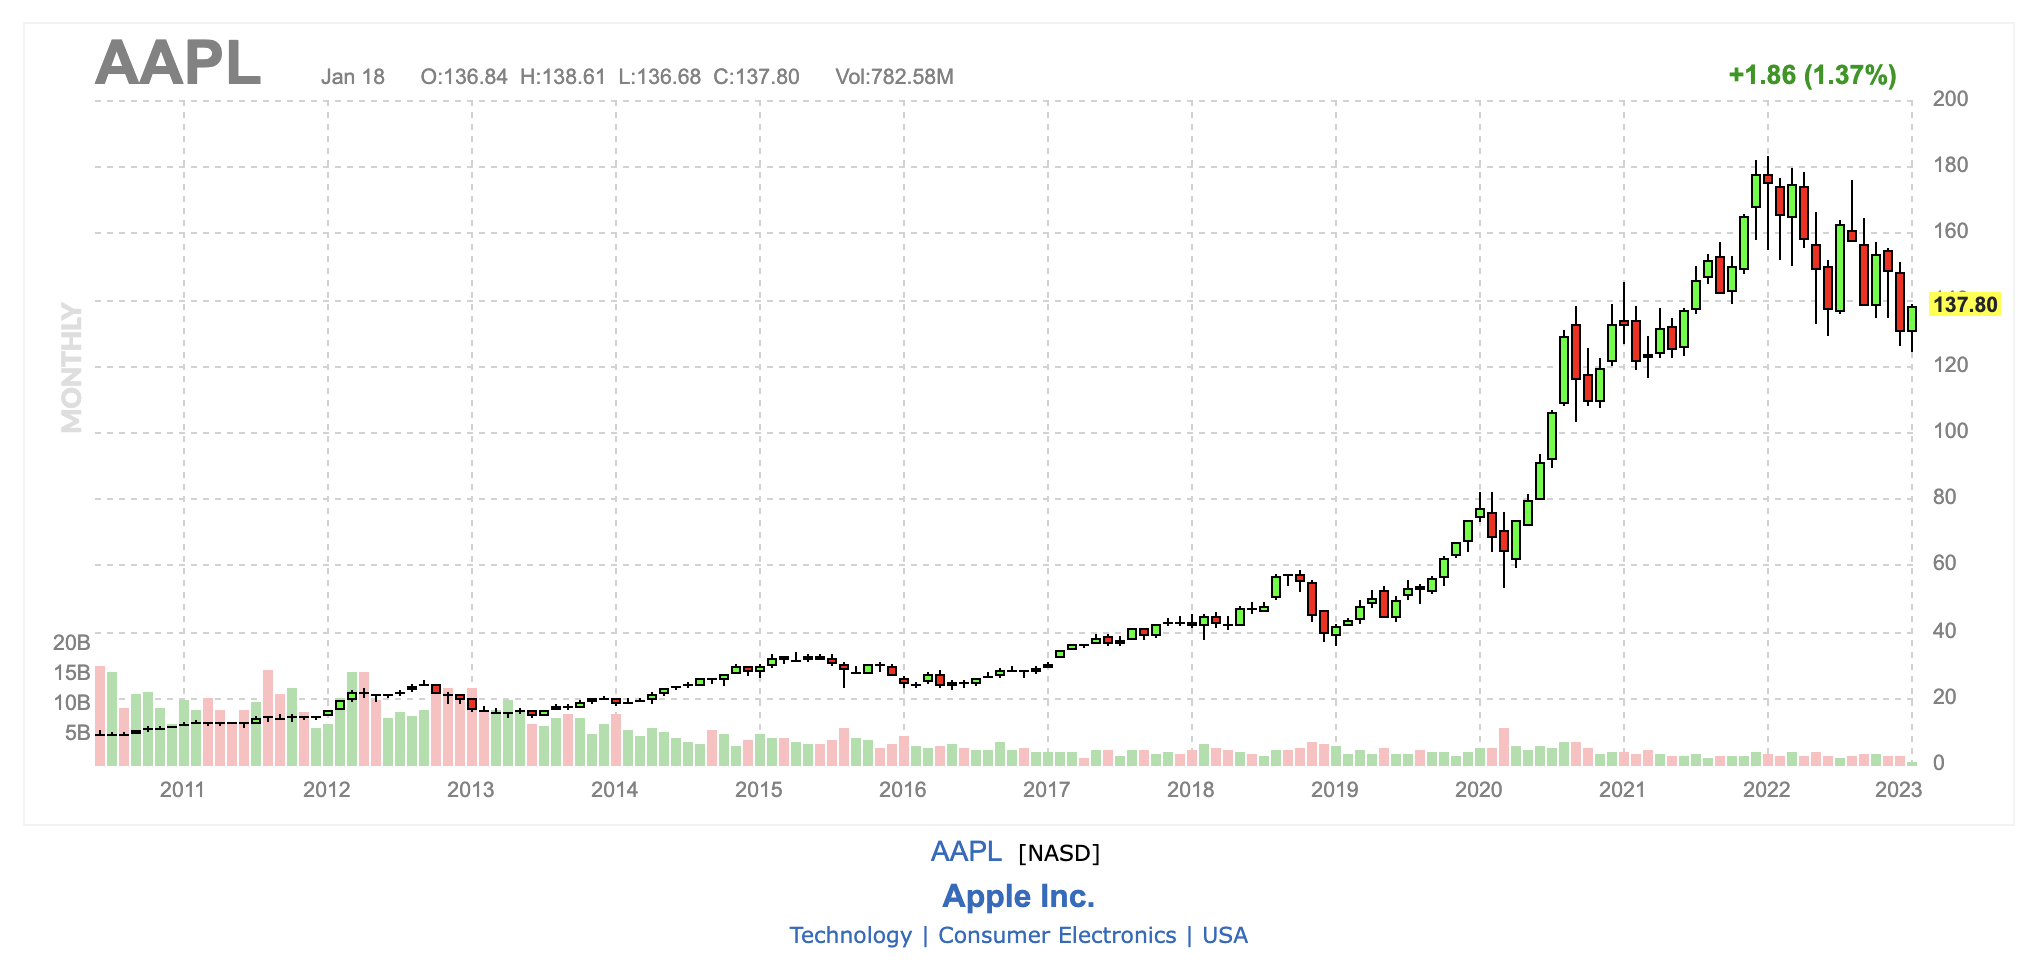
Apple (AAPL) stock chart, source: finviz.com
So it is basically hard to apply these financial ratios to the biggest companies in the world, like Google, Apple, Microsoft, Amazon, etc. Let’s go a little lower. PayPal currently has a $91.7 billion market cap, down almost 75% from its peak at around $300. The stock is now at $79, with P/E at 40.7, so investors expect the stock to be higher in the future.
P/B is at 4.57, a little overvalued. Other financial ratios also look fine, just debt to equity is 0.53, which is slightly more than we would like to see. However, PayPal is one of the largest payments companies in the world, so a lot of investors must be eyeing the stock as it’s down 75%, plus the ratios point to the fact that the company is fairly valued, or a little overvalued.
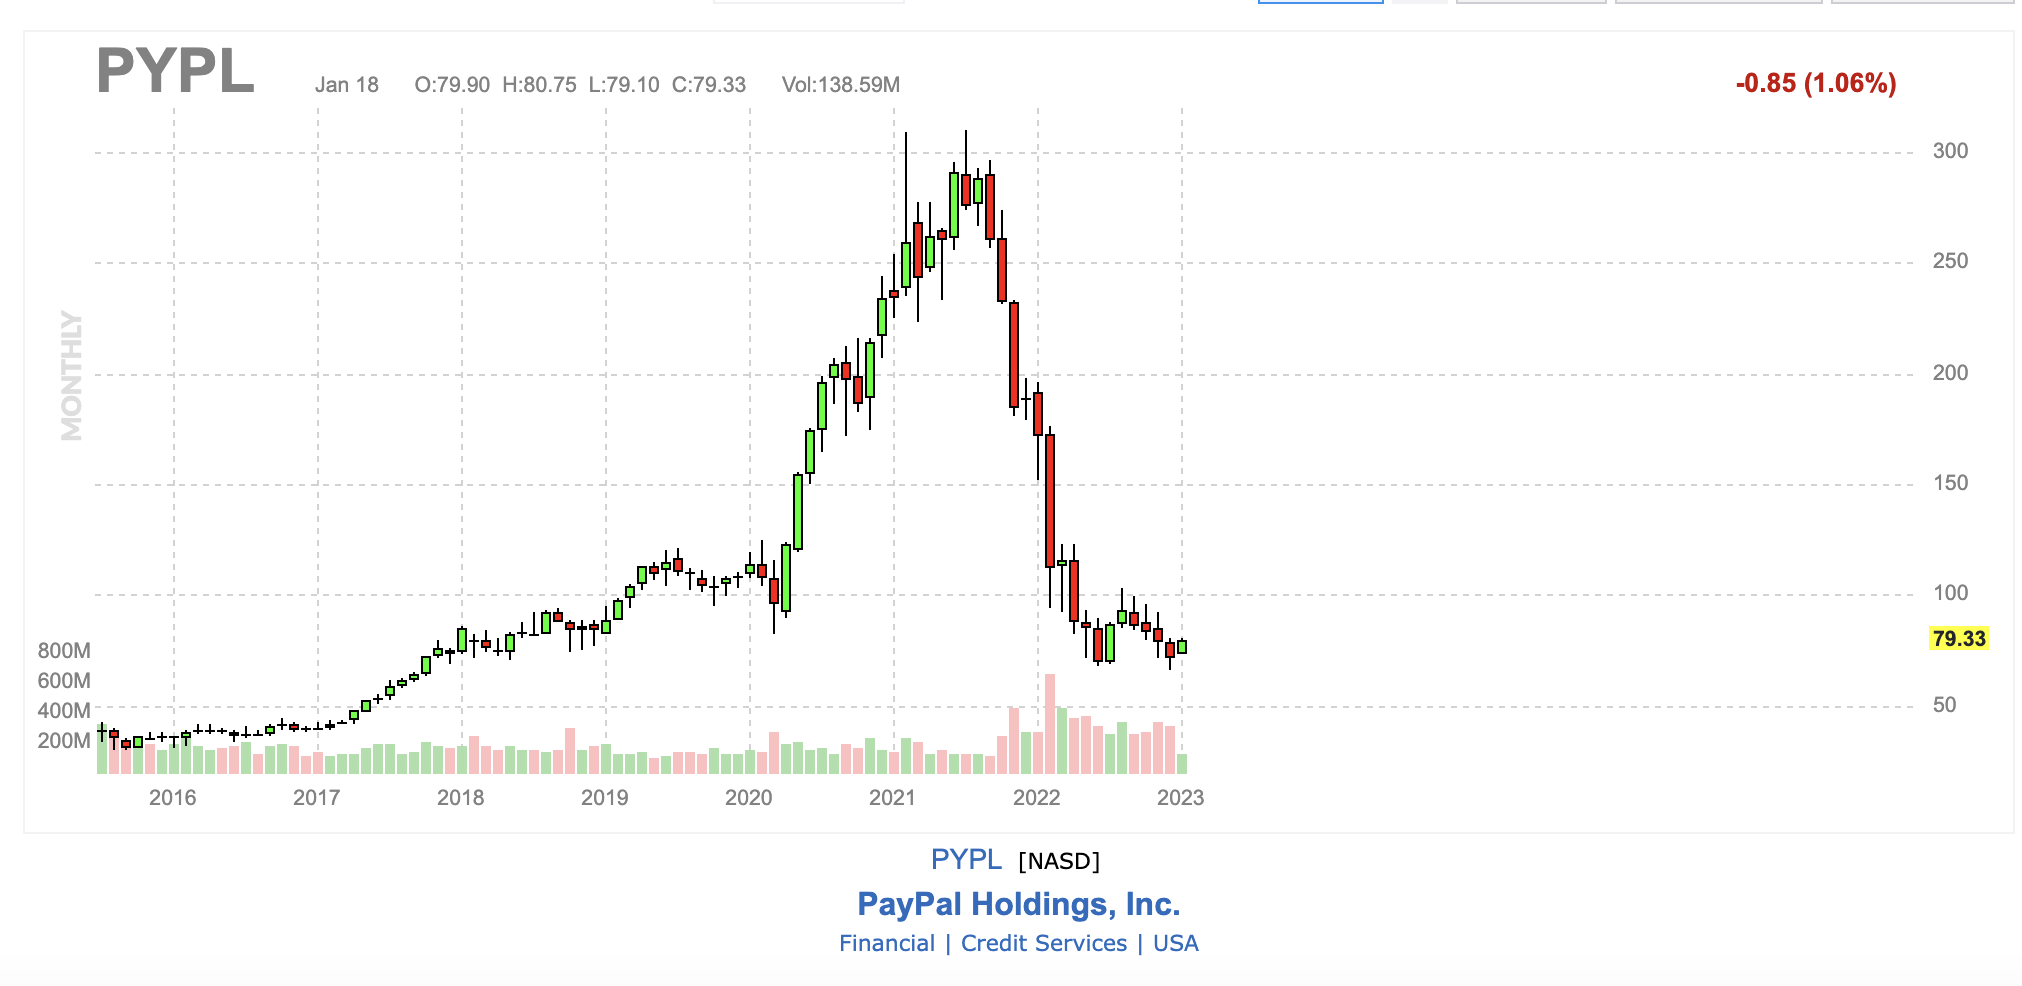
PayPal (PYPL) stock chart, source: finviz.com
Conclusion
Hopefully, this article has helped you understand how to use financial ratios in investing better. There are many different types of financial ratios, and it can be hard to keep up with all of them, but these are the most important ones. And more importantly, remember it’s not all about financial ratios.
Your investment decisions should be long-term focused, and with a touch of diversification, dollar-cost averaging, and solid analytical skills. Moreover, remember that markets are also influenced by interest rates, inflation, unemployment, GDP, and other economic measures.


Comments
Post has no comment yet.