2022 will go down in history as one of the worst years regarding investing, as cryptocurrencies and stocks took a big hit. However, the critical question remains: has the market bottomed out, or will it continue to go down?
1. High interest rates and inflation
All central banks now have a common goal: to bring the inflation rate down. This week, Fed, BoE, and SNB all increased interest rates by 50 bps or 75 bps and will continue to do so until 8-9% inflation starts to come down. While there were almost zero interest rates one year ago, BoE is at 2.25%, Fed at 3.25%, and SNB’s rates were lifted to 0.5% from -0.25% for the first time since 2011.
Related article: FOMC showed absolute hawkishness – what it means in practise
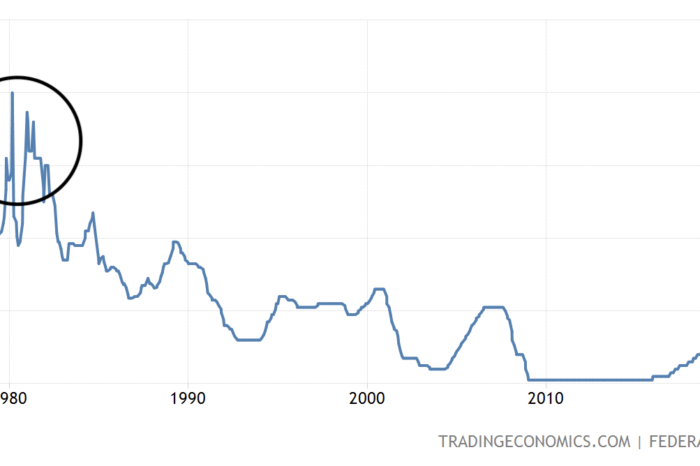
When comparing these high-inflation times to the 80s, interest rates are still pretty low. Fed raised them up to 20% to tackle the raging inflation. The markets tumbled until the moment Fed decided to lower them again, which signalled a stock market bottom in early 1982. This points to the fact that stocks won’t probably bottom out until Fed and other central banks bring the inflation to their goal so they can start lowering rates again.
2. TMC/GDP
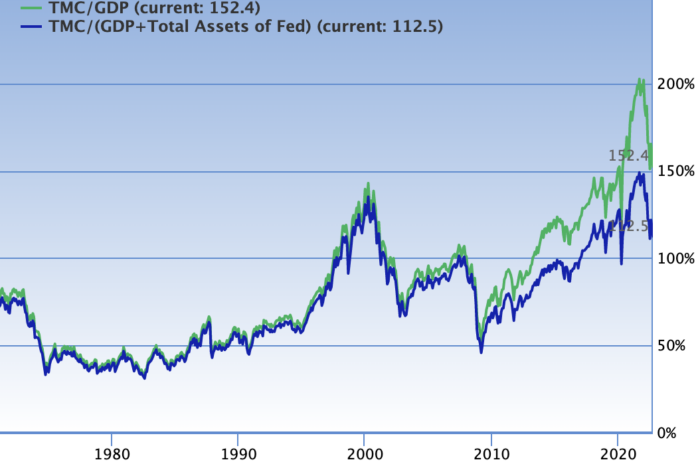
The Buffett indicator known as TMC/GDP (the ratio of total market cap to US GDP) is already showing a steep decline from its overvalued zone at 200% to the recent 152.4%. As it is still above 145%, it is considered “significantly overvalued,” and it is not recommended to invest when this indicator is at such high levels. Moreover, if the hawkish policy continues in the next year, this index could decrease further, which means cheaper stocks.
Also read: Putin declares partial mobilization and escalates the war
The Total Market Index currently stands at $37,915 billion, or roughly 152.4% of the most recent GDP, as of this writing. Based on historical stock market valuations, the US stock market is predicted to have an average annualized return of 1.6% or continue downward. During the high inflation times in the 1980s, TMC/GDP indicator sat between 40% to 50% for years. So although the fall doesn’t have to be that strong, there is definitely a lot of space for another market decline.

TMC/GDP indicator, source: link
3. Technical analysis
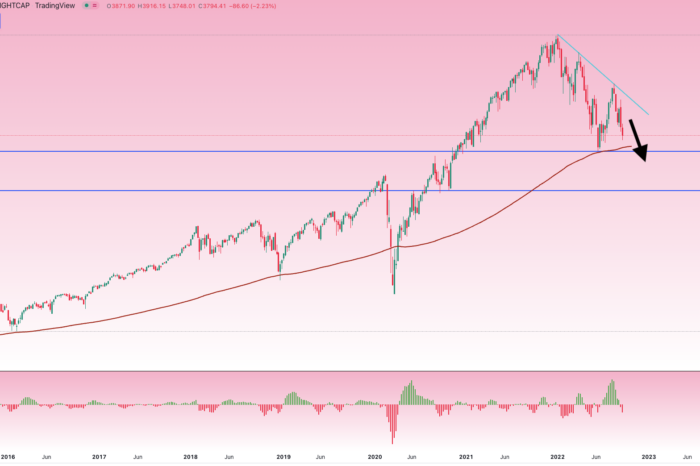
The U.S. stock index S&P 500 topped out just below $5,000 at the end of 2022 and fell by about 20% since then. This index had only a few declines over the last decades that were larger than 20%. However, the index clearly shows regular lower highs and lower lows. The bears gain strength with every price decrease. It’s probably only a matter of time when the S&P 500 hits the support of $3,633 again or breaks lower to another support at $3,234.
The COVID-powered growth was too big and artificial, so now investors have to pay the price for easy and quick gains by getting the opposite. This index is not alone, as Nasdaq lost about 30% from its peak, and DAX is surprisingly down by “only 20%” despite the ongoing energy crisis in Europe.
The bottom line
Should you invest in stocks right now? Several mentioned indicators show that the recession is still ongoing, and the bottom is not in yet, so the one-time investment may be risky at the moment. However, dollar-cost-averaging could be one of the best ways to profit in the long run as you do not have to time the market and just rely on the long-term trend of stocks.


Comments
Post has no comment yet.