The US dollar has been declining against all the other fiat currencies since October despite continuous rate hikes. NZD/USD specifically experienced a strong uptrend of 1,000 pips which might be over as the currency pair refused to rise over a resistance 0.6464.
Downtrend is still in the play
NZD/USD climbed from 0.5510 to 0.6500, but then clearly rejected to rise above the resistance. A significant reversal pattern was formed, already sending the currency pair 200 pips lower. Divergence in the weekly timeframe confirms a stronger move to the downside could occur in the next few weeks.
Related article: USD/JPY collapses after surprise BoJ policy shift
There is an ongoing downtrend for approximately two years and this was the biggest pullback since the market turned downward. That is why it is anticipated this downtrend will continue, with NZD/USD eyeing 0.6000.
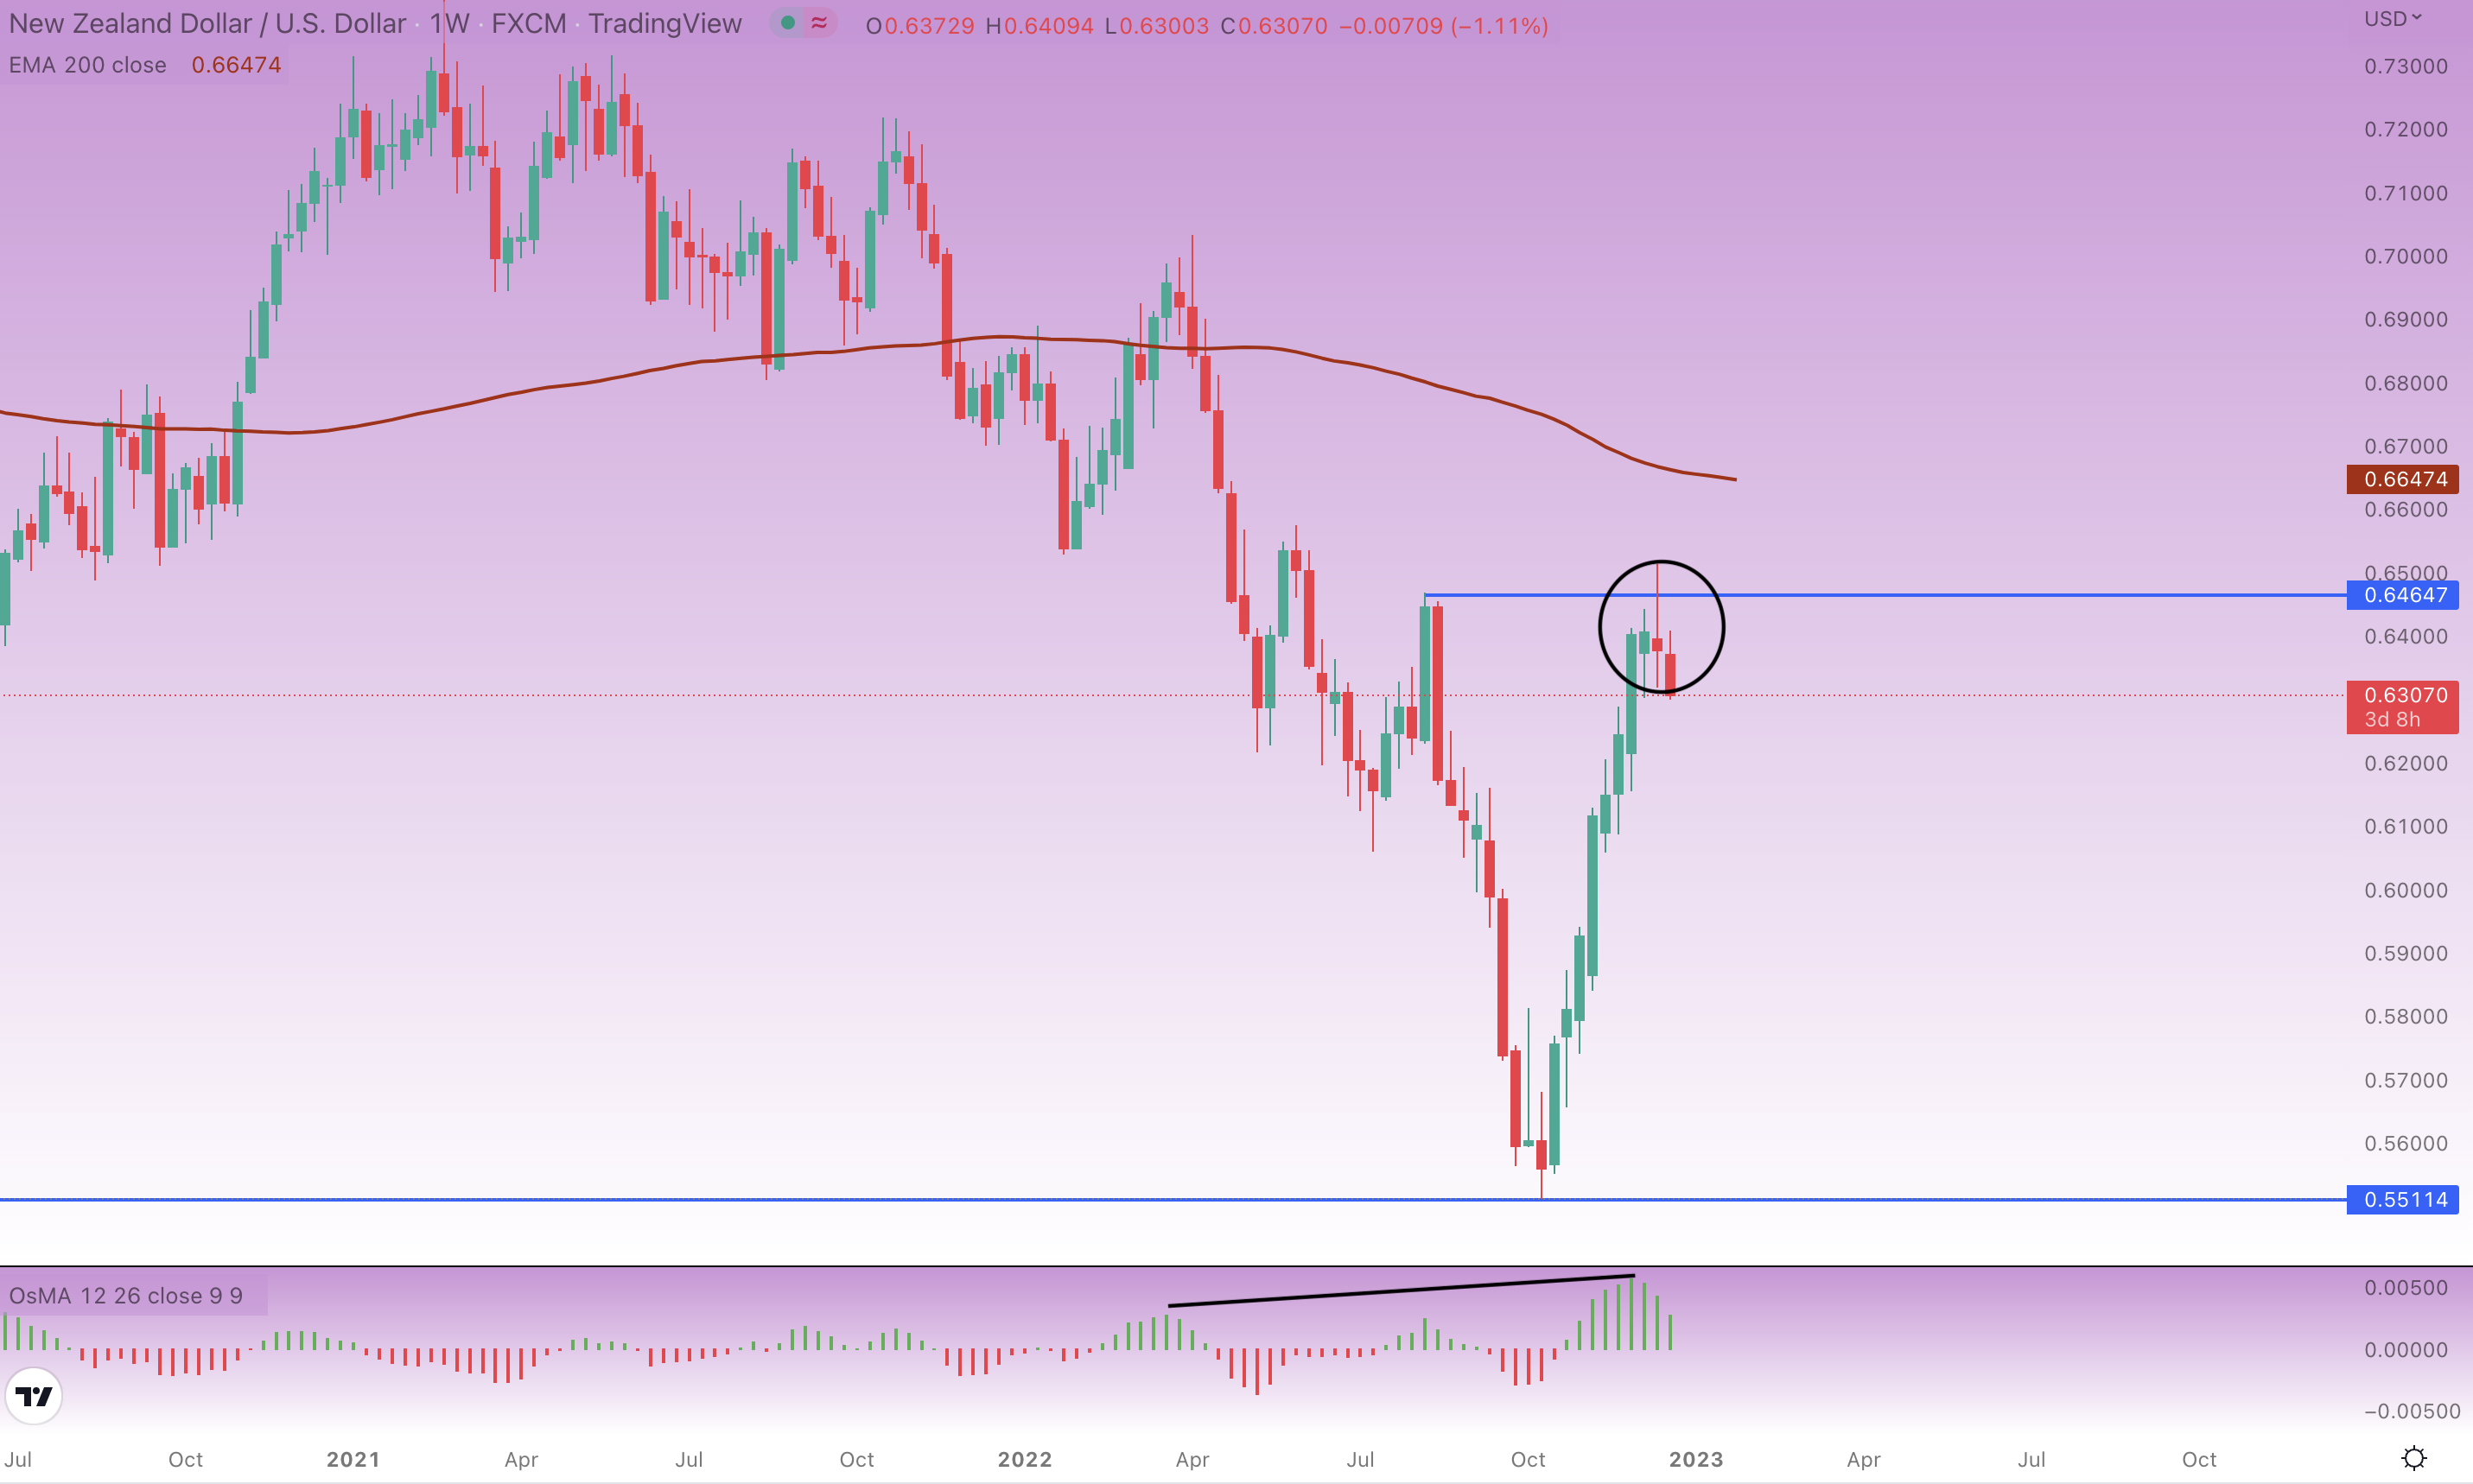
NZD/USD weekly chart, author’s analysis, source: tradingview.com
Resistance clearly rejected
NZD/USD broke a crucial trend line that held the uptrend. Now there is there a big chance we could see the currency pair moving lower despite the fact that the OsMA indicator is pointing to a buy signal.
There is no support besides the moving average (EMA200), so NZD/USD may be headed somewhere between 0.6000 and 0.6100. The currency pair will probably aim to create a higher low before the uptrend can be confirmed, so NZD/USD may not necessarily be heading to 0.5511.
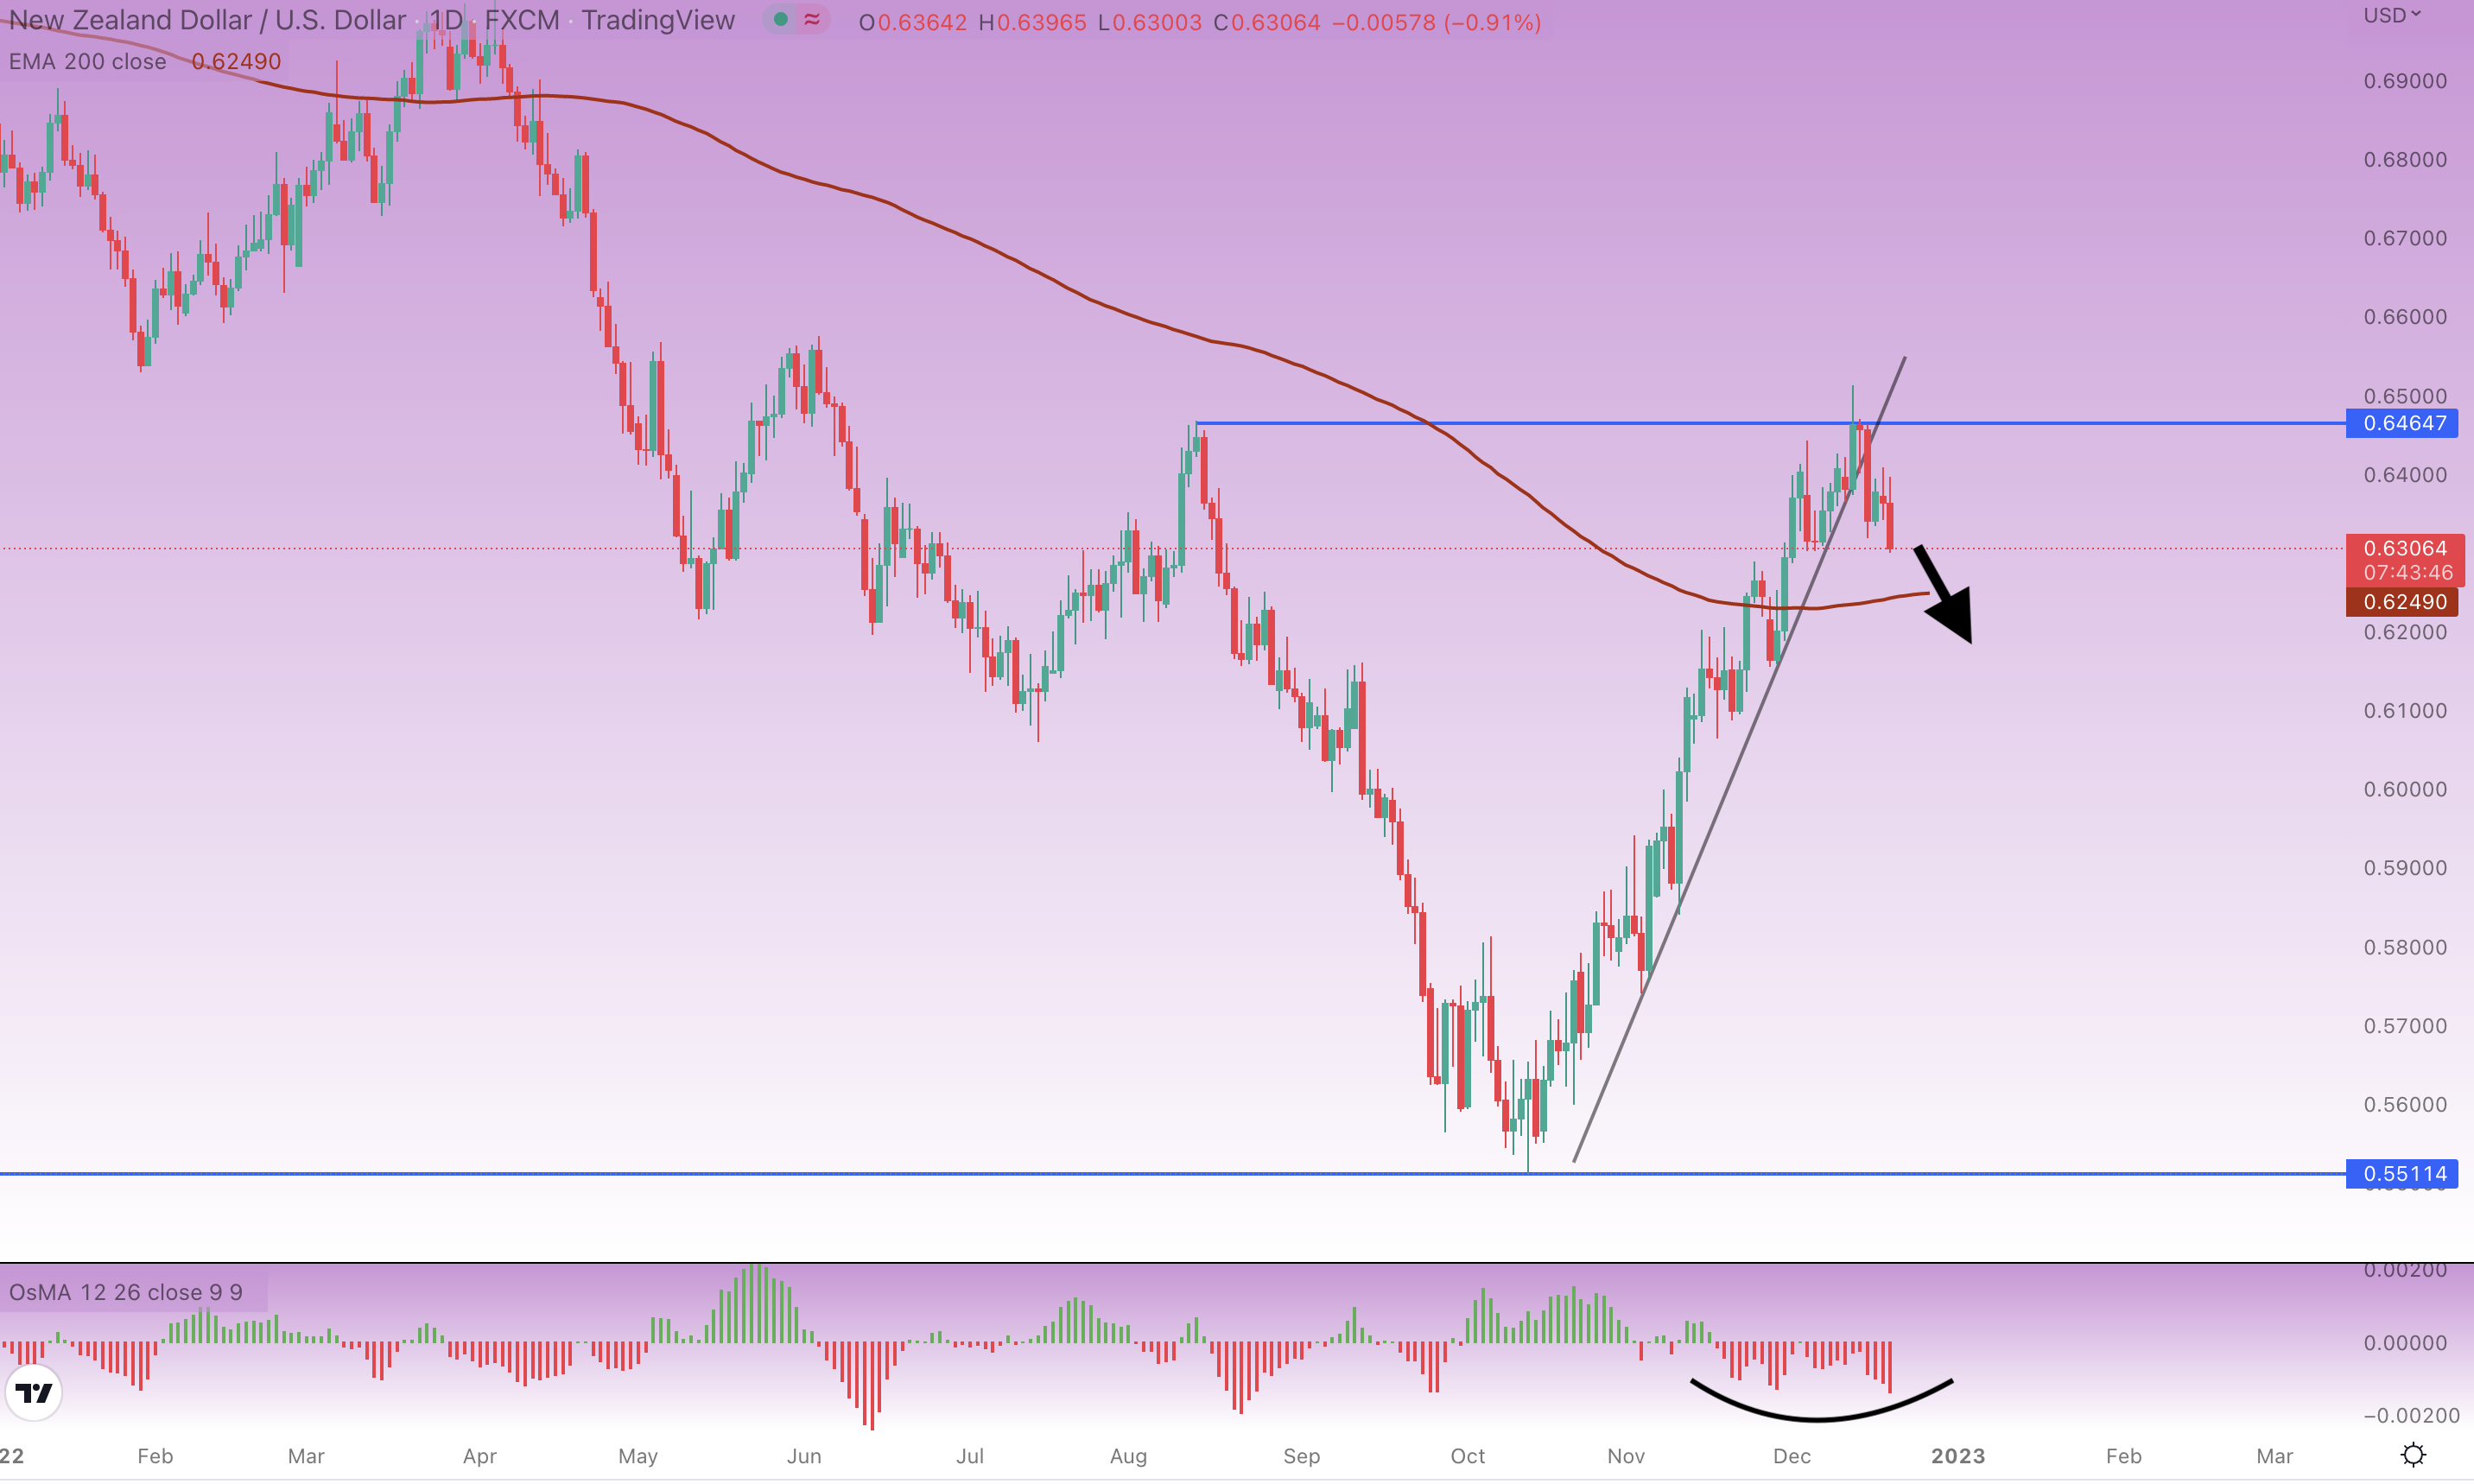
NZD/USD daily chart, author’s analysis, source: tradingview.com
Smaller timeframe confirmations
Even a wedge pattern has been formed and broken on the 4-hour timeframe. Moreover, a head and shoulders (H&S) pattern suggests the currency pair will be moving downward, with a small divergence as well.
Also read: Argentina with Lionel Messi made it – but ARG token did not
Make sure to check smaller timeframes too if you are still not certain about this trading signal. It could still retest the resistance and aim higher, so be cautious about the entry. Wait for the final confirmation – seeing a breakout of the neckline (the support from the H&S).
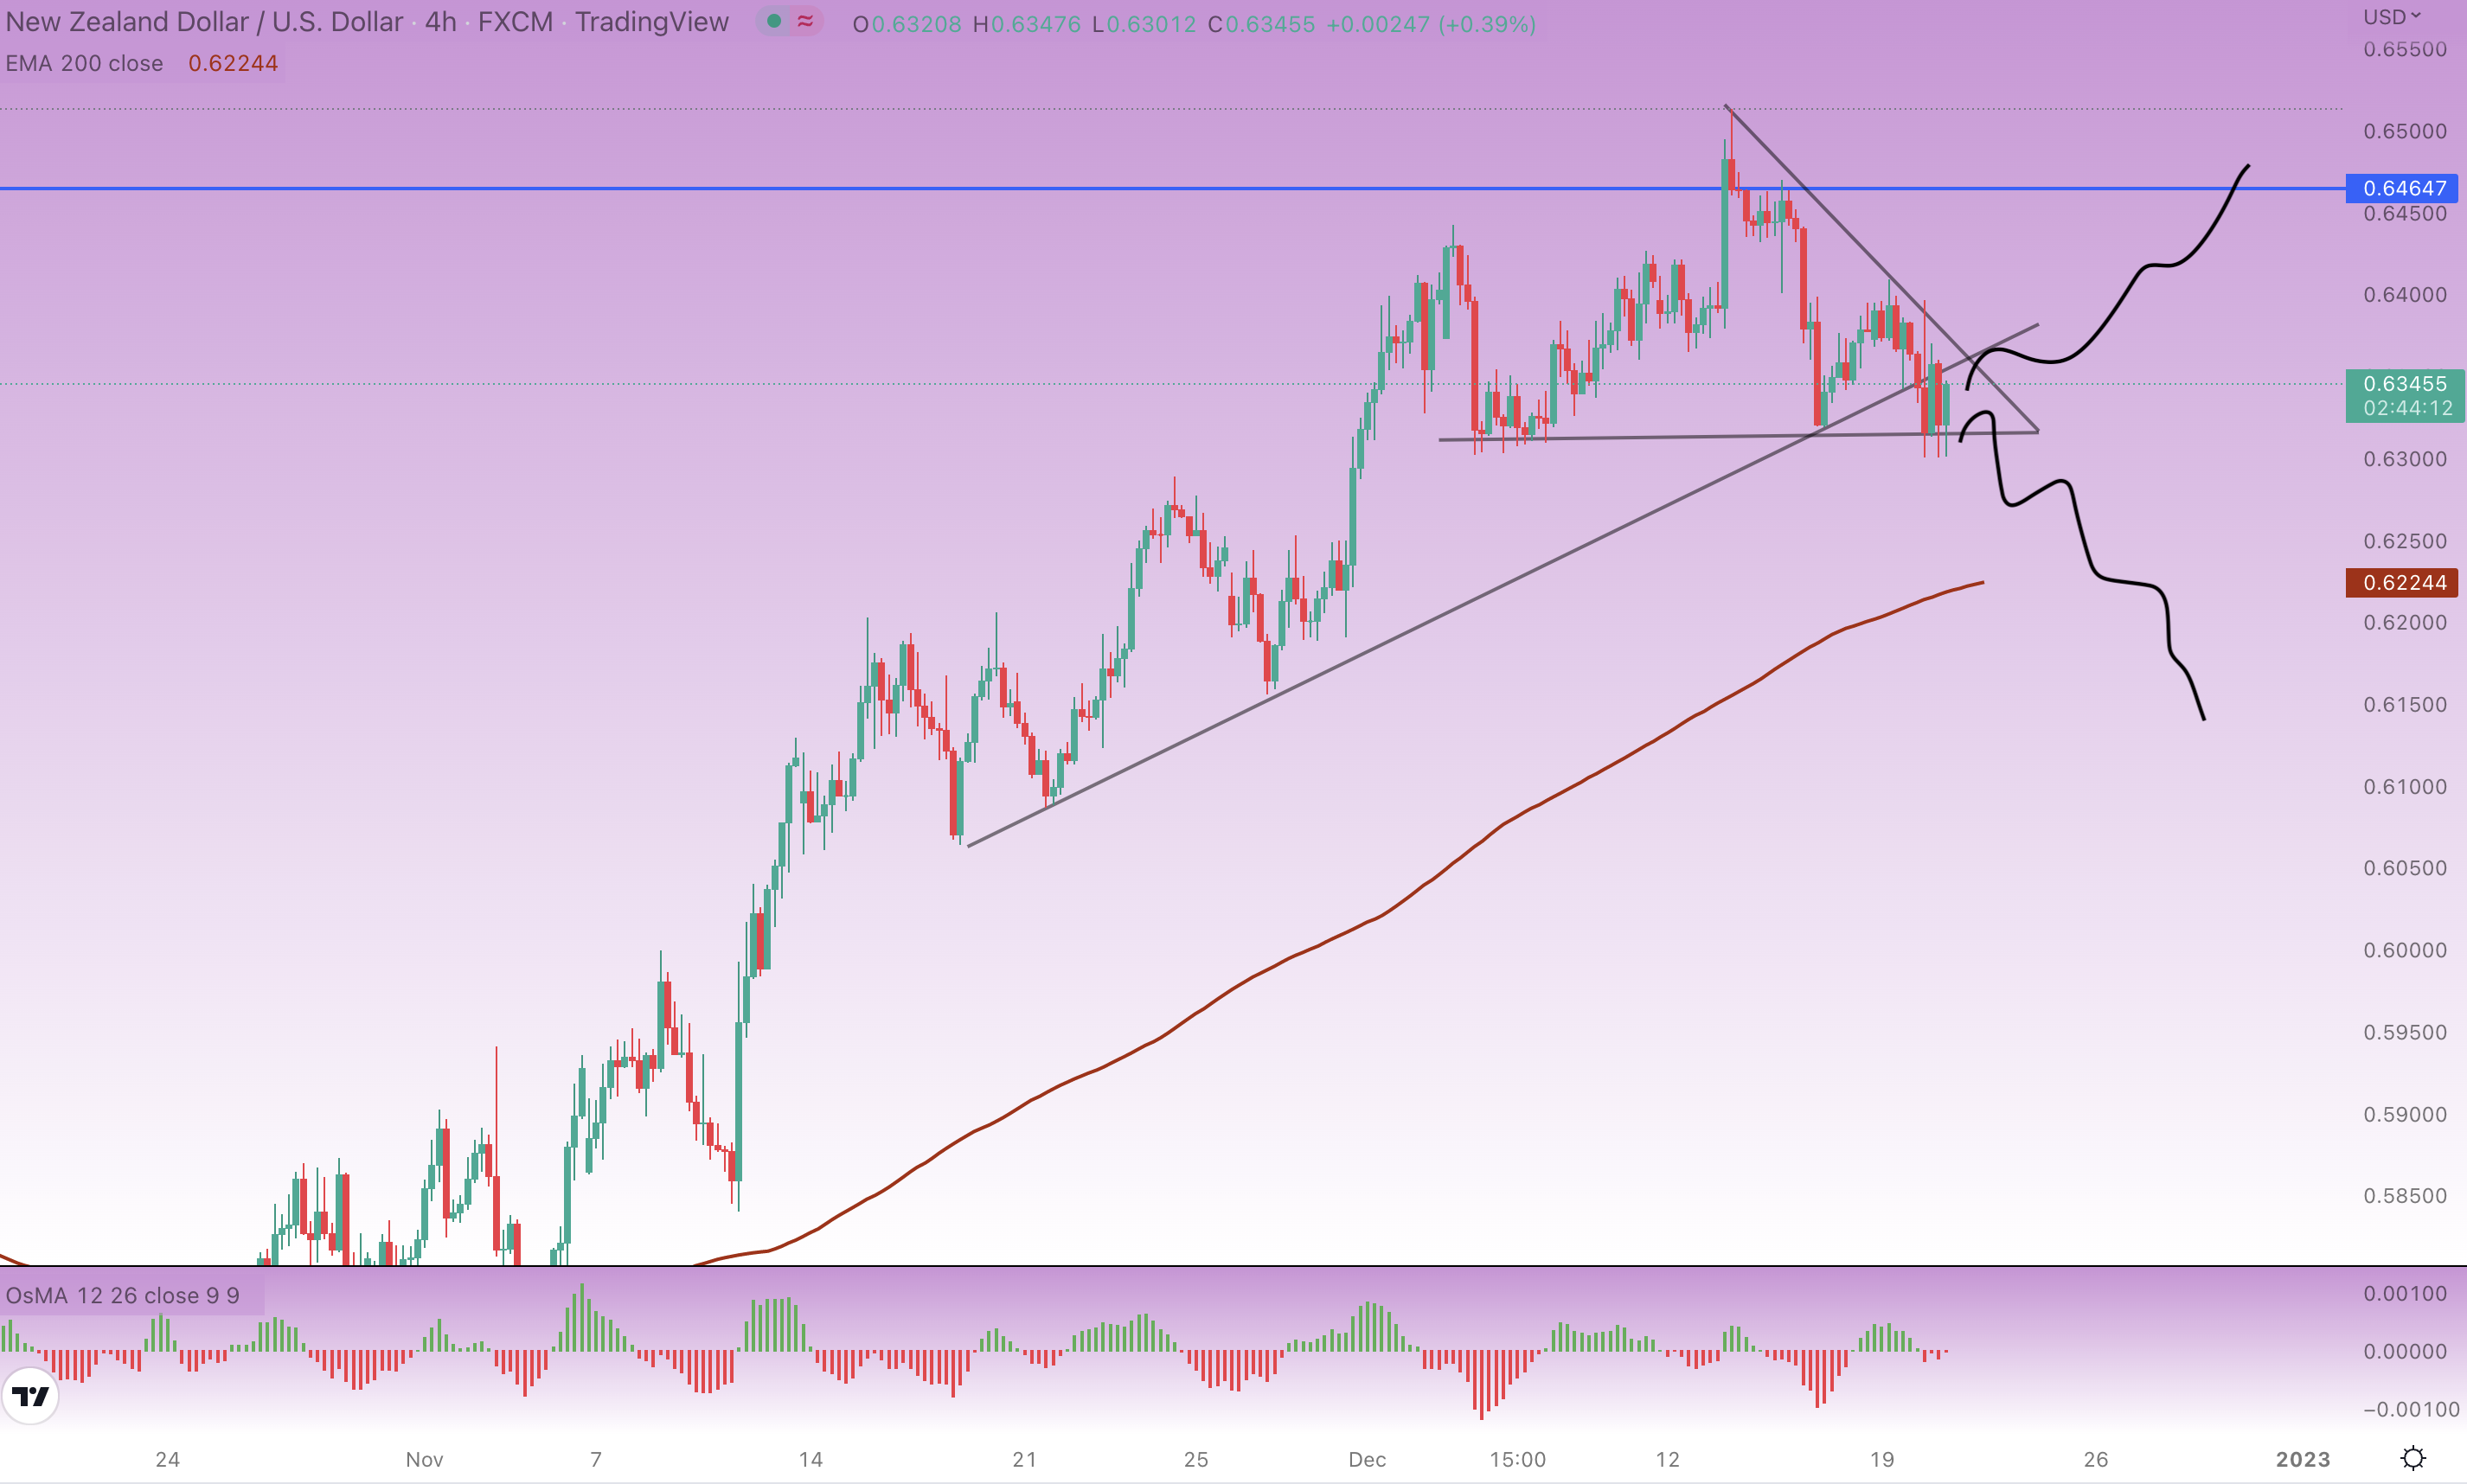
NZD/USD 4-hour chart, author’s analysis, source: tradingview.com
In my opinion, stoploss between 100 to 200 pips should be enough to withstand the volatility. Traders should target a profit of at least 200 to 300 pips. A new year is around the corner, so make sure you are prepared because this may be a time of surprisingly high volatility.


Comments
Post has no comment yet.