Bitcoin saw the largest weekly surge in almost two years. Its price increased by 25% in just one week, delivering the long-awaited relief rally. Investors are celebrating, thinking the crypto winter is over. But is it really?
Weekly timeframe analysis
#Bitcoin just had the biggest weekly gain in 100 weeks (since Feb 2021). 🚀 pic.twitter.com/XmsBG1aJo3
— Bitcoin Archive (@BTC_Archive) January 14, 2023
As shown in the tweet, Bitcoin had the strongest week in 100 weeks. This is a great sign for long-term investors, who can see that crypto is definitely not “dead.” However, it may be a dangerous zone to enter long positions.
Related article: Tether beats Visa and Mastercard in transaction volume in 2022
Looking at the weekly timeframe, it is visible that the bullish divergence succeeded as Bitcoin is up 37% from the bottom of $15,462. Bitcoin even rose above the price when FTX collapsed. All these signals suggest that the worst might be behind us and crypto is poised to perform well this year.
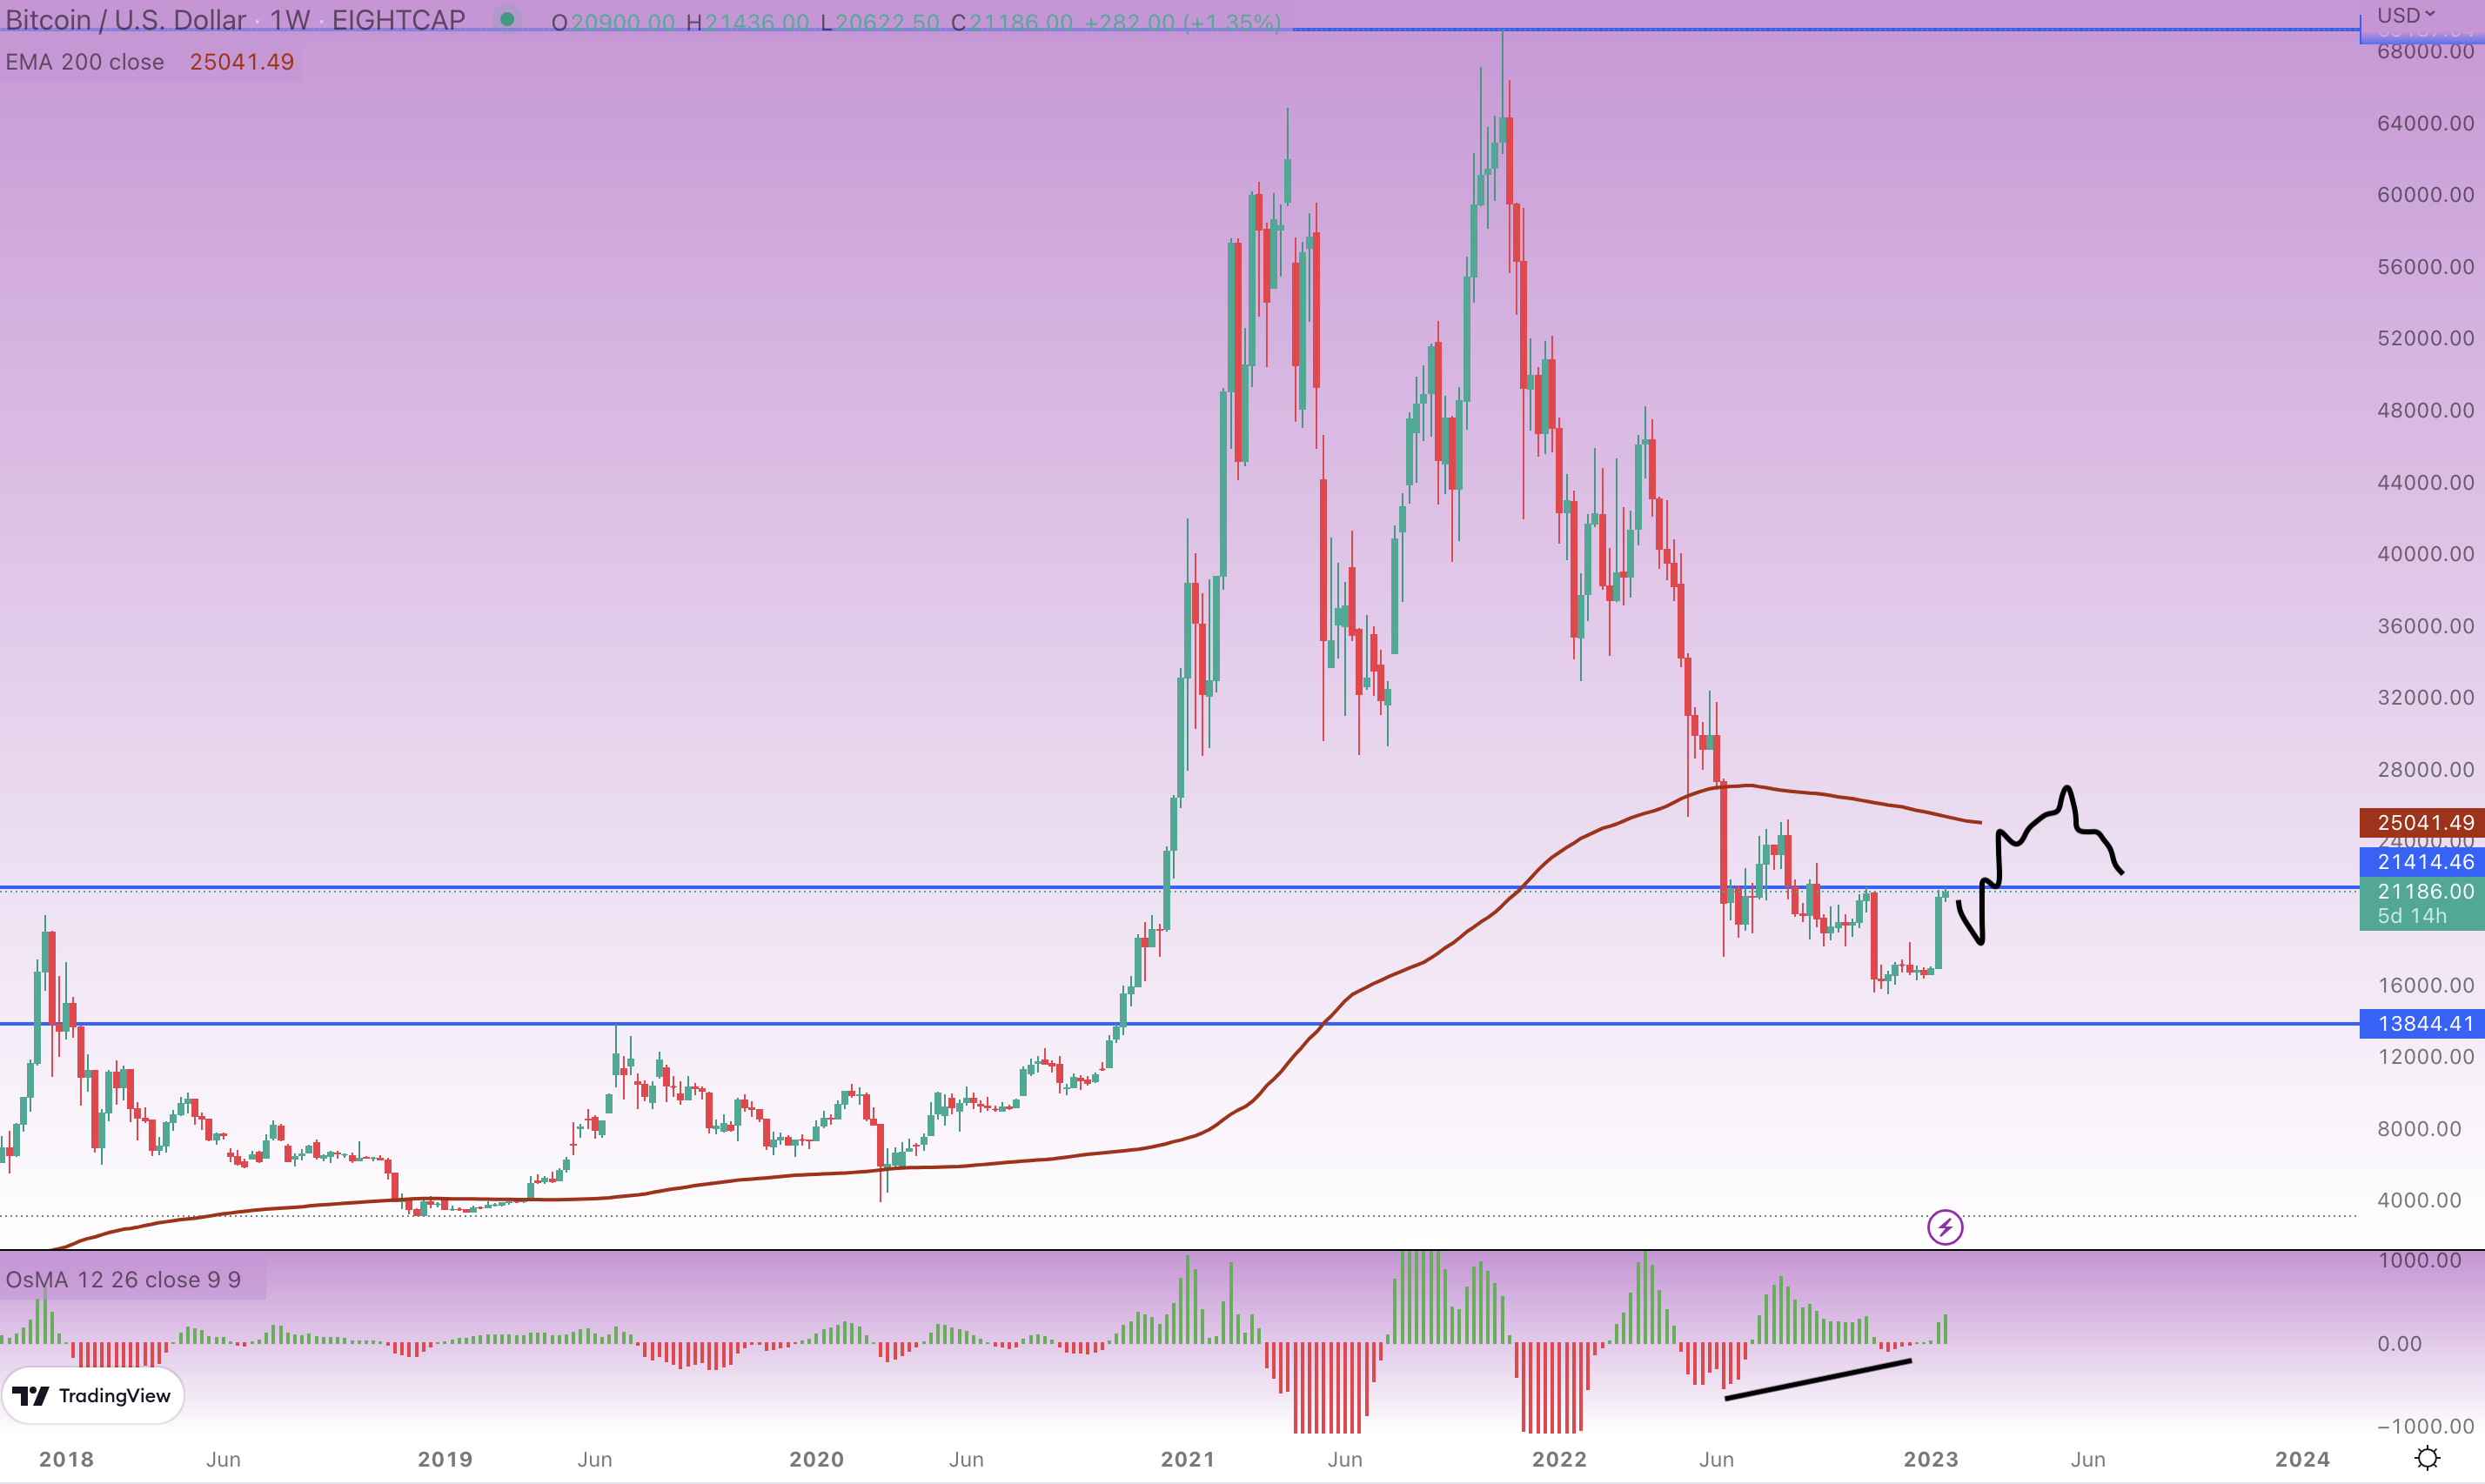
Bitcoin weekly chart, source: tradingview.com, author’s analysis
Daily timeframe analysis
Bitcoin broke the trend line on a daily timeframe, which is also a solid bullish confirmation as the downtrend has been invalidated. But now BTC is sitting at resistance and the OsMA indicator is overbought. Bitcoin even rose to the moving average (EMA200), which didn’t happen since April 2022.
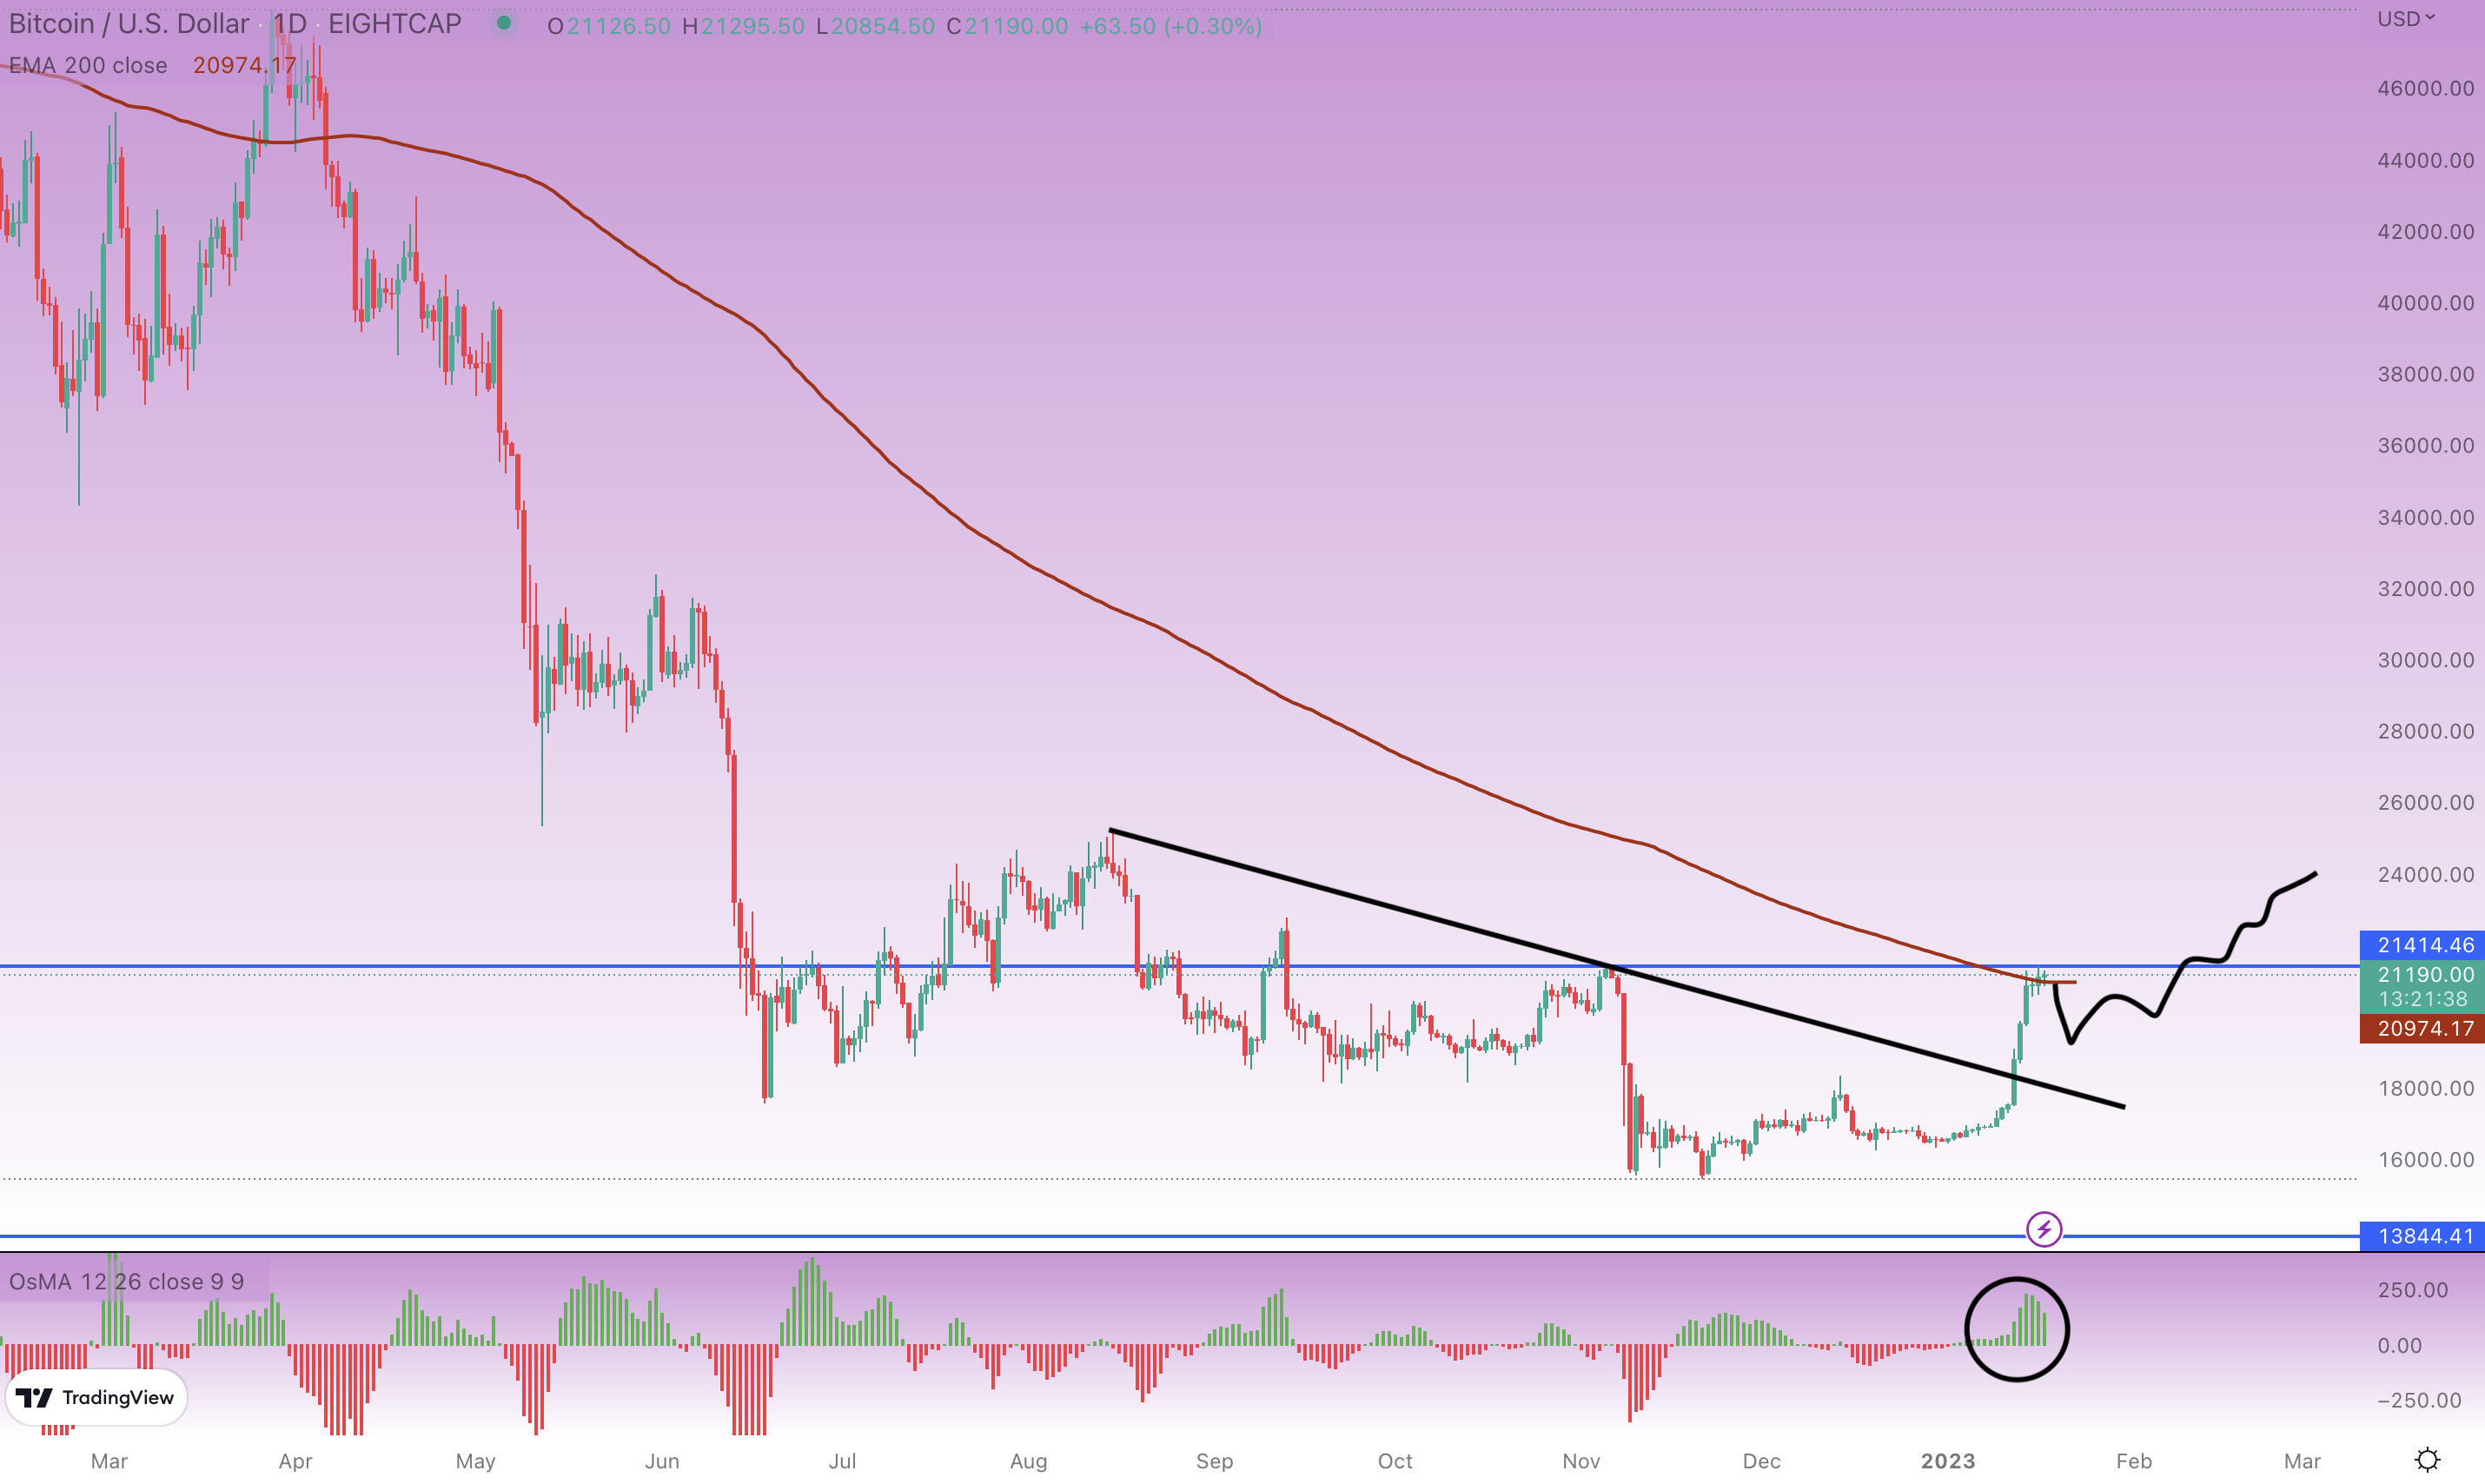
Bitcoin daily chart, source: tradingview.com, author’s analysis
From the short-term perspective, Bitcoin is poised to fall between $19,000 and $20,000. However, there is a notable accumulation by bulls, who could push Bitcoin’s price higher, up to $30,000 in 2023.
Also read: Which 5 crypto billionaires lost over $110 billion in 2022?
Nevertheless, it will be crucial to confirm the uptrend with higher highs and higher lows in a daily timeframe. So if Bitcoin slides lightly and then breaks the current resistance, it could easily jump up to $30,000 as the overall sentiment significantly improved.


Comments
Post has no comment yet.