The benchmark SP500 index erased today’s losses and traded flat at around 4,500 USD heading into Friday’s US session.
Inflation causing concerns
Yesterday’s US inflation data caused strong selling in US equities as the CPI index continued to rise to 40-year highs.
Shortly after, the St.Louis Fed’s Bullard “hit the wires,” urging a 50bps hike as soon as possible and suggesting an inter-meeting hike (and a Q2 start to quantitative tightening).
US yields exploded higher along with rate-hike odds, with the 50bps hike by March now fully priced in. The Fed has not started a rate-hike cycle with a 50bps increase since 1990. Additionally, the market is pricing in a 75% chance of 7 rate hikes this year.
The 2-year yield rocketed 20% higher to trade above 1.6% for the first time in more than two years. At the same time, the 10-year yield soared above the psychological 2% threshold.
Furthermore, there are whispers of an emergency Fed rate hike as soon as today or Sunday/Monday. So it is undoubtedly going to be an exciting couple of days.
Documenting the utter chaos in the rate market was the greatest front-month Fed Funds Futures volume ever. The volumes were at 300,000 in late Thursday trading, that’s about eight times more than usual levels.
Later today, the US Michigan consumer sentiment index for February is due, expected to improve slightly. However, continuous inflation and the recent decline in the stock markets could have caused more pain for consumers, so the report might actually come out below expectations.
Additionally, the Fed monetary policy report is due today. This report is submitted semiannually to the Senate Committee on Banking, Housing, and Urban Affairs and to the House Committee on Financial Services, along with testimony from the Federal Reserve Board Chair.
Daily chart is not that negative
However, it looks like equity investors don’t believe the rate markets as the SP500 index remains above its 200-day moving average at 4,460 USD (the green line) as today’s dip to that level was quickly bought. Therefore, the medium-term outlook remains bullish.
If we see a rally today, the resistance is expected near 4,550 USD. Alternatively, any selling pressure will be met with buying pressure near the mentioned 200-DMA, with another support probably at 4,440 USD. Volatility will likely increase once US exchanges open for trading.
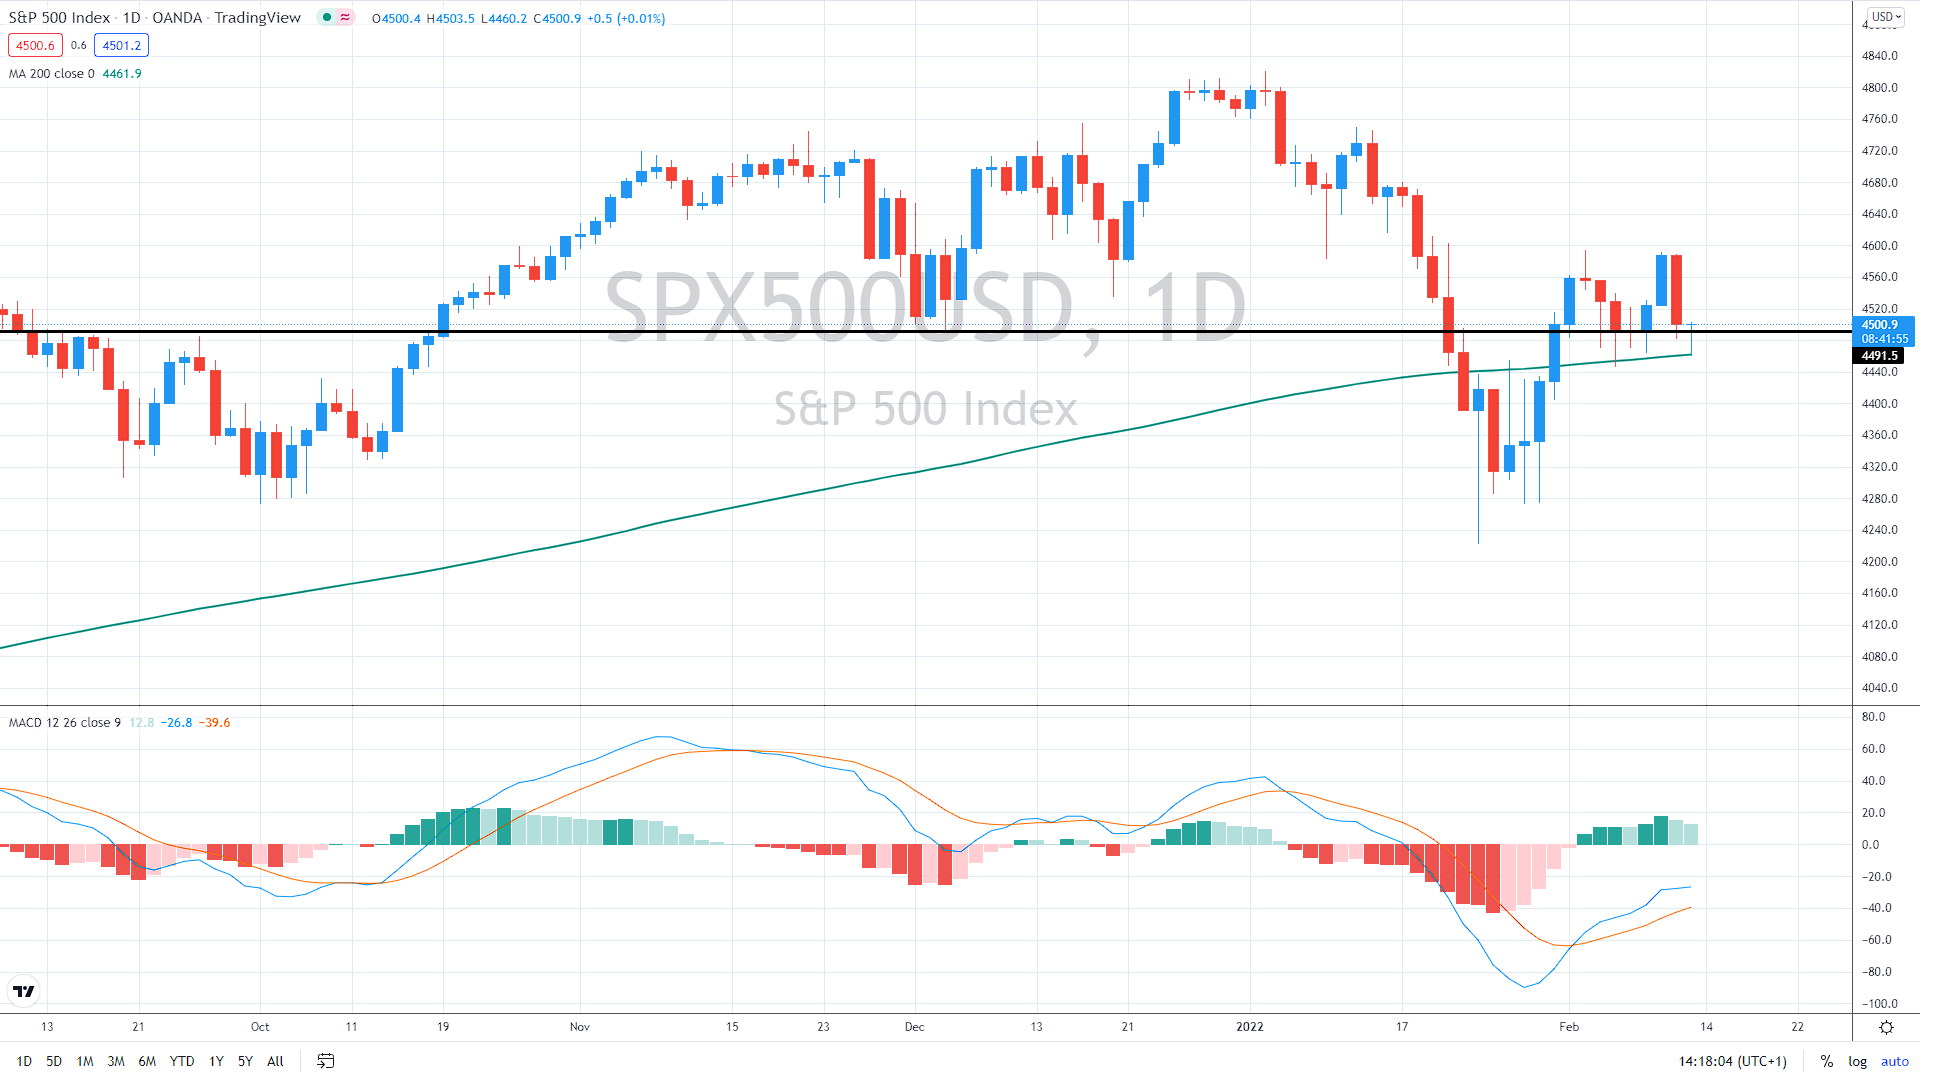
SP500 daily chart, Source: Author´s analysis, tradingview.com


Comments