All major metals surged after the Fed lifted interest rates, but erased gains in the following hours. Now platinum flashes a red signal with danger ahead.
Platinum top-down technical analysis
After platinum reached a crucial resistance a little above $1,000, it is showing signs of weakness. It failed to move above the trend line and OsMA on the weekly timeframe shows the commodity is currently overbought.
Related article: Silver ahead extreme macro data week – where is it headed?
If platinum manages to break the trend line that held the uptrend since September, it may dive back to the support at $836, or even lower. It will be important to watch what happens in the next few days, so let’s switch to the daily timeframe.
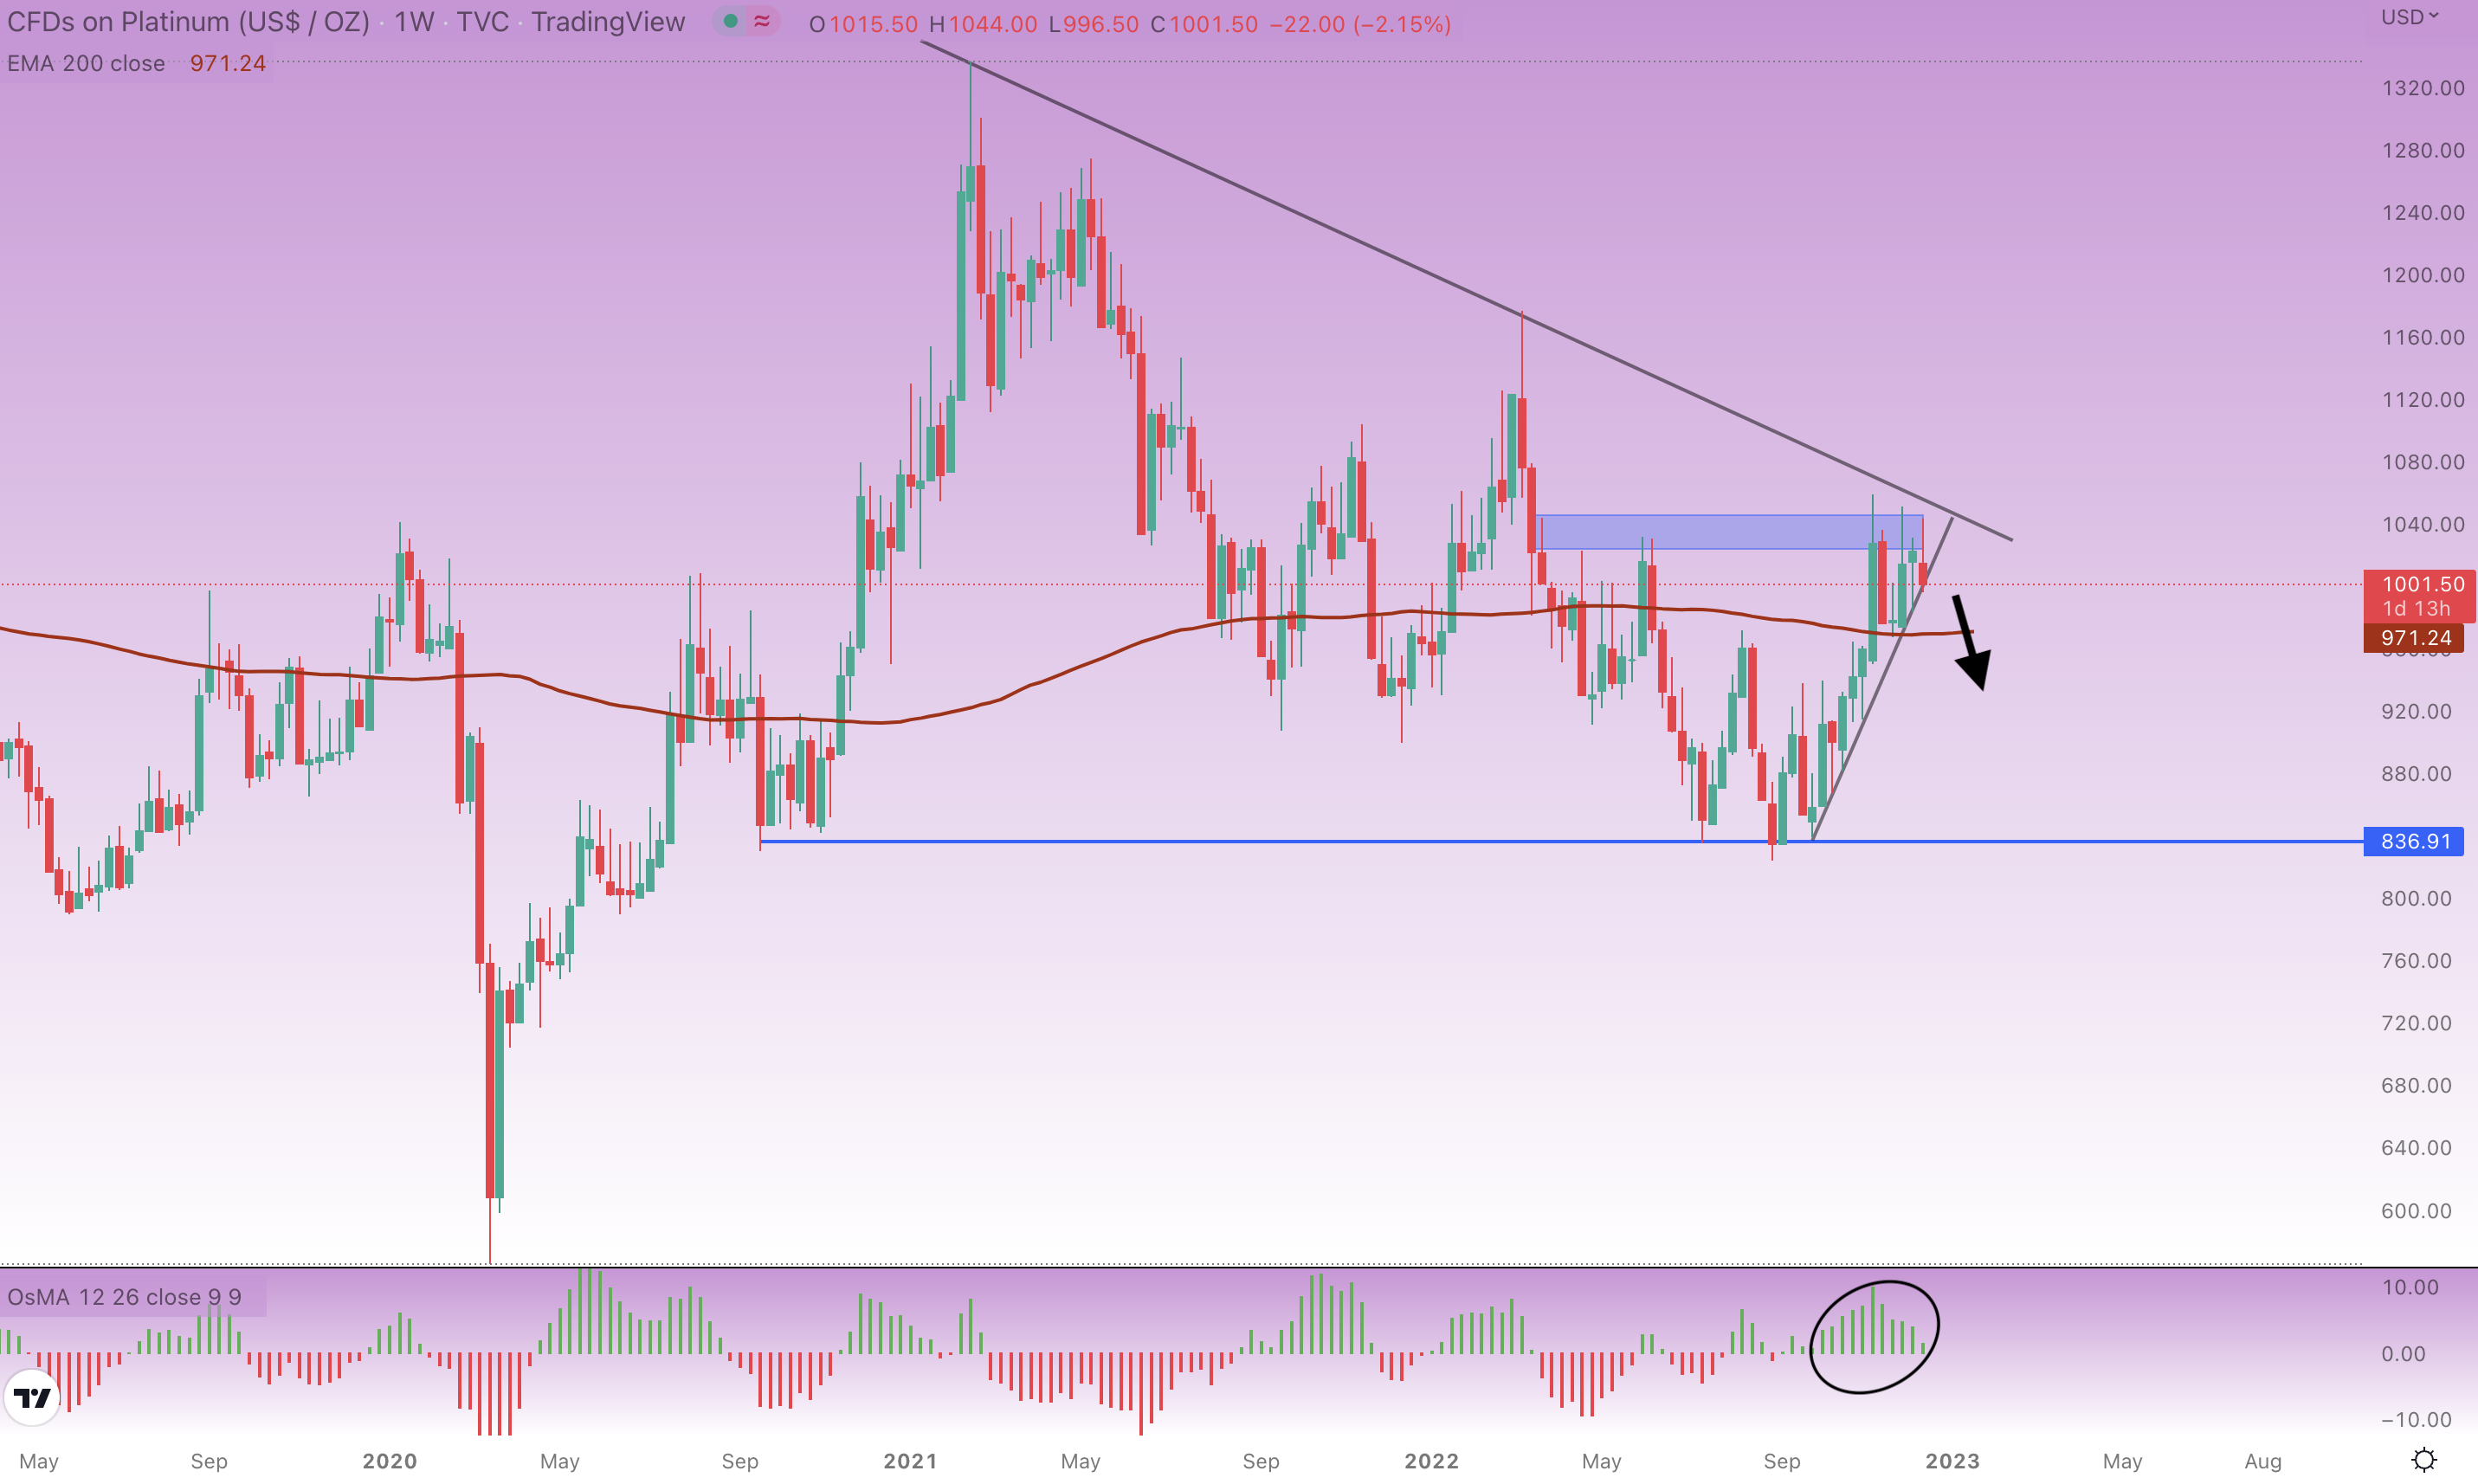
Platinum weekly chart, source: tradingview.com, Author’s analysis
The daily timeframe shows mixed signals on the OsMA indicator, but the chart is sending a clear message. There is a possible triple top formation. If this trading pattern helps with a break of the trend line downward, a sell signal is confirmed.
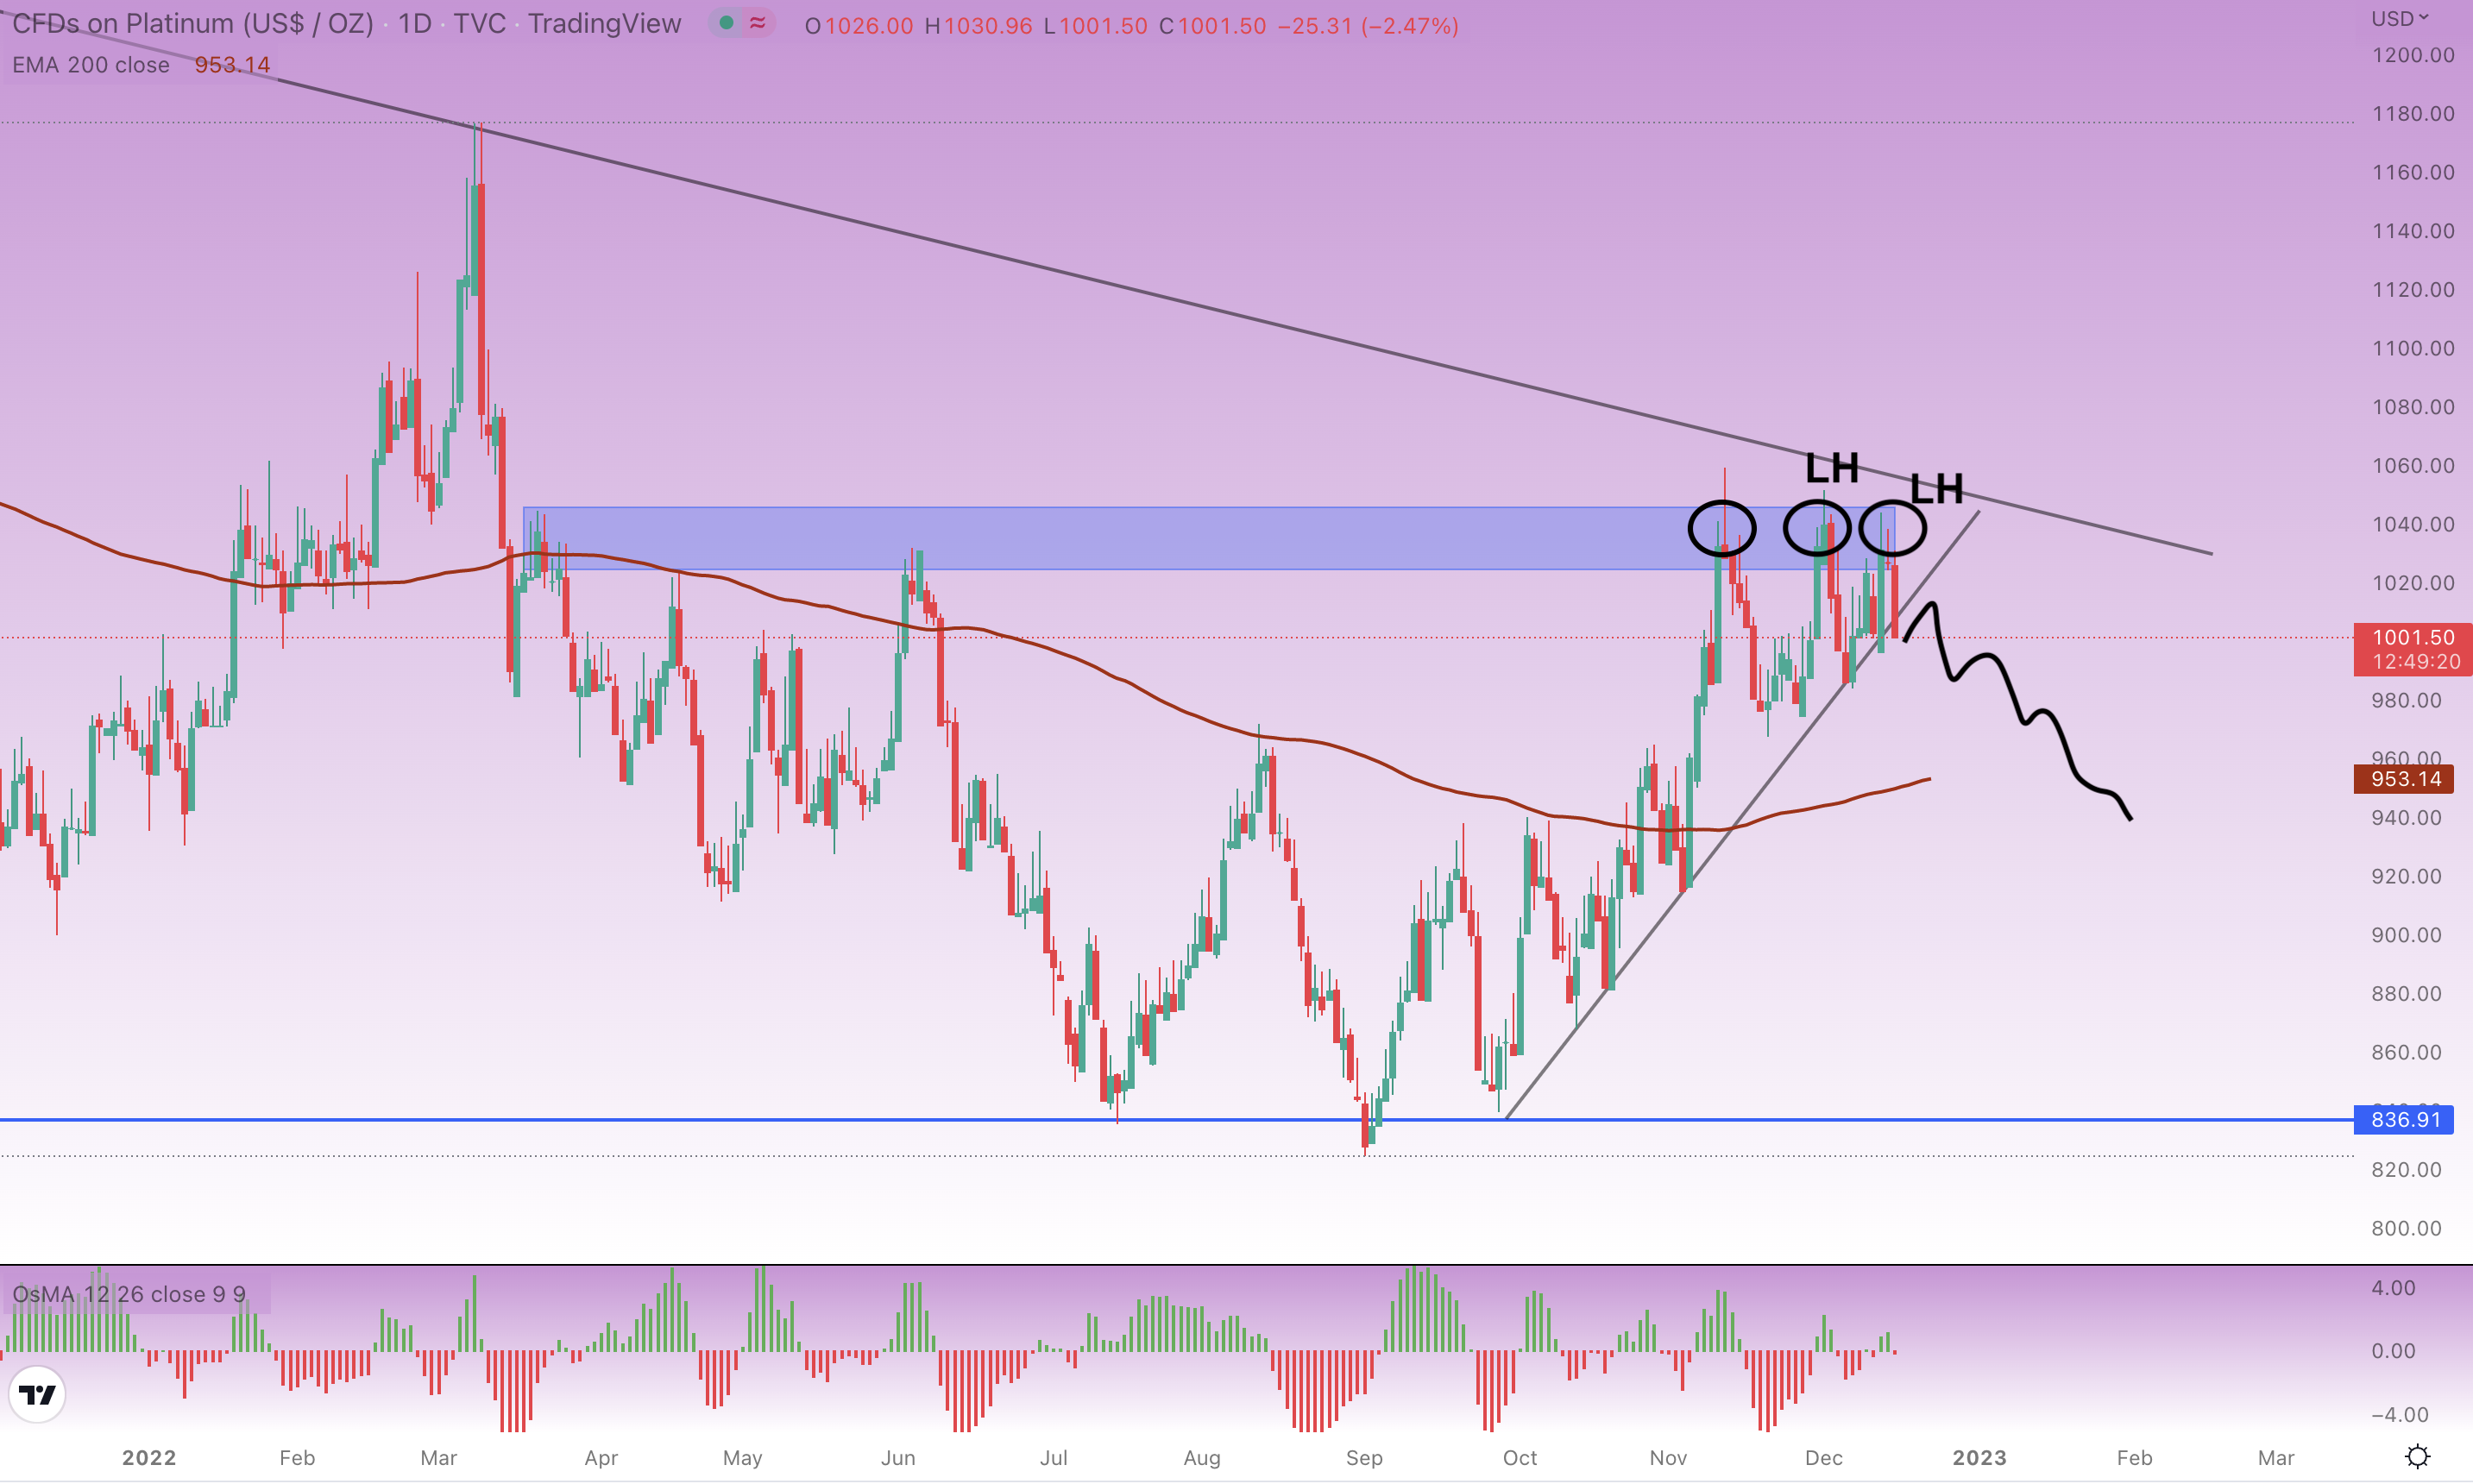
Platinum daily chart, author’s analysis, source: tradingview.com
Platinum has also started creating lower highs (LH) recently, which is another indication of bulls leaving their long positions. The commodity could be headed well below $1,000, possibly leading to a red start in the next year.
Also read: Tesla falls below another key technical level
When we look at the platinum closer, it’s still not sure which direction it will go. The 4-hour timeframe shows the commodity is currently between two important trend lines, and the breakout of one of them will outline the next direction.
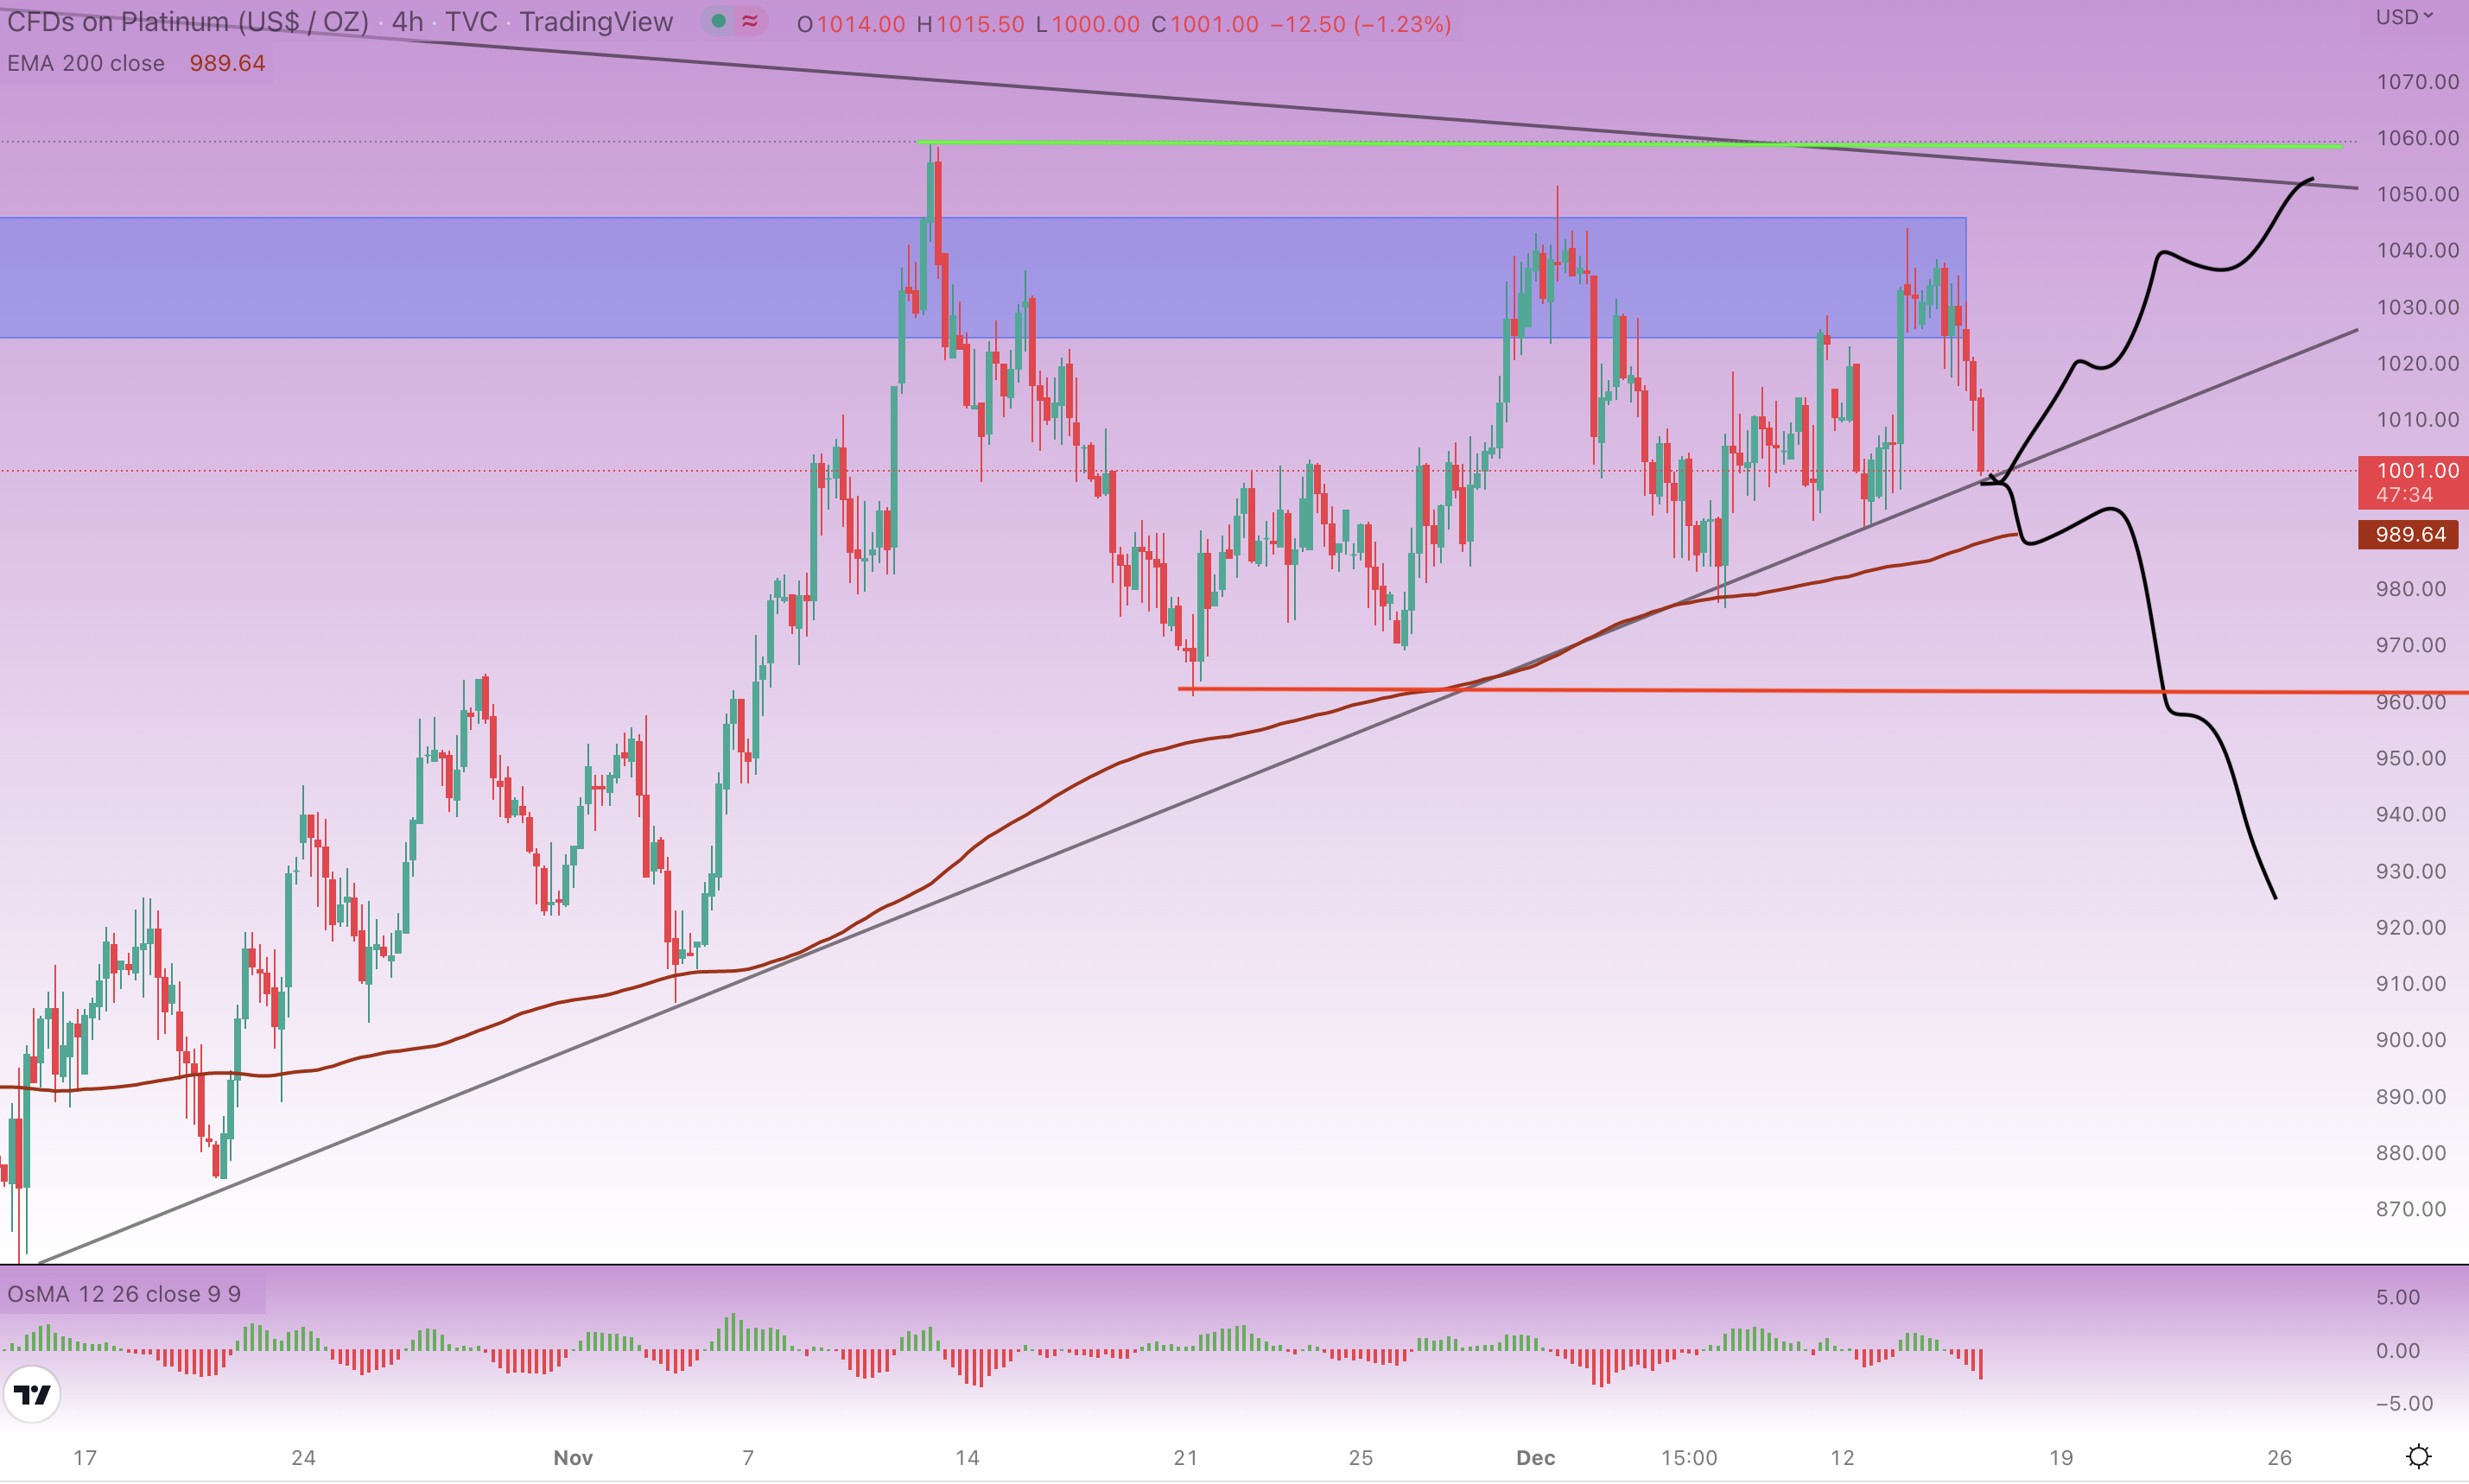
Platinum 4H chart, author’s analysis, source: tradingview.com
So, the breakout below the red line would essentially mean a confirmation for bears, but a breakout above the green line would indicate this technical signal is wrong and platinum may be ready to extend its gains.
Final thoughts
Make sure to wait for the confirmation signal of these two levels as several false breakouts can occur between them. As always, be patient, disciplined, and don’t forget to manage your risk in trading. Protect your capital at all costs.


Comments
Post has no comment yet.