Fed raises to 5.25%
Fed delivered expected numbers and hiked interest rates by 25 bps to 5.25% from the previous 5%. It should be the last rate hike in a while and therefore markets look at this step positively. In recent days stocks gained and treasury yields declined, as the signal of a possible pause in rate hikes. The main gameplayer is inflation, and policymakers ensured that they will closely watch this indicator and do whatever needs to make inflation decline.
Read more: Fed kicks off its meeting – will this hike be the last?
Higher than expected rate hike would signal an unsatisfactory pace of hiking, and losing the fight with inflation. But expected results signal that inflation declines enough to make a pause in further higher rates. Which could be a relief for stressed markets. Higher rates hurt the banking industry in general, and high inflation cools the economy with higher unemployment with a decline in consumer spending. Lower consumer spending negatively affects retail and wholesale, and manufacturing.
Gold´s golden month?
May started for gold with appreciation. Just in the first three days, the volatility on gold futures tops 3%, and the whole effect of the Fed´s meeting is not counted. The main reason is of course monetary policy, but declining treasury yields open the way up for yellow metal. The possible pause in rate hike gives gold, the non-interest asset, wings. With the hint that higher rates could be less possible, the competitiveness raises.
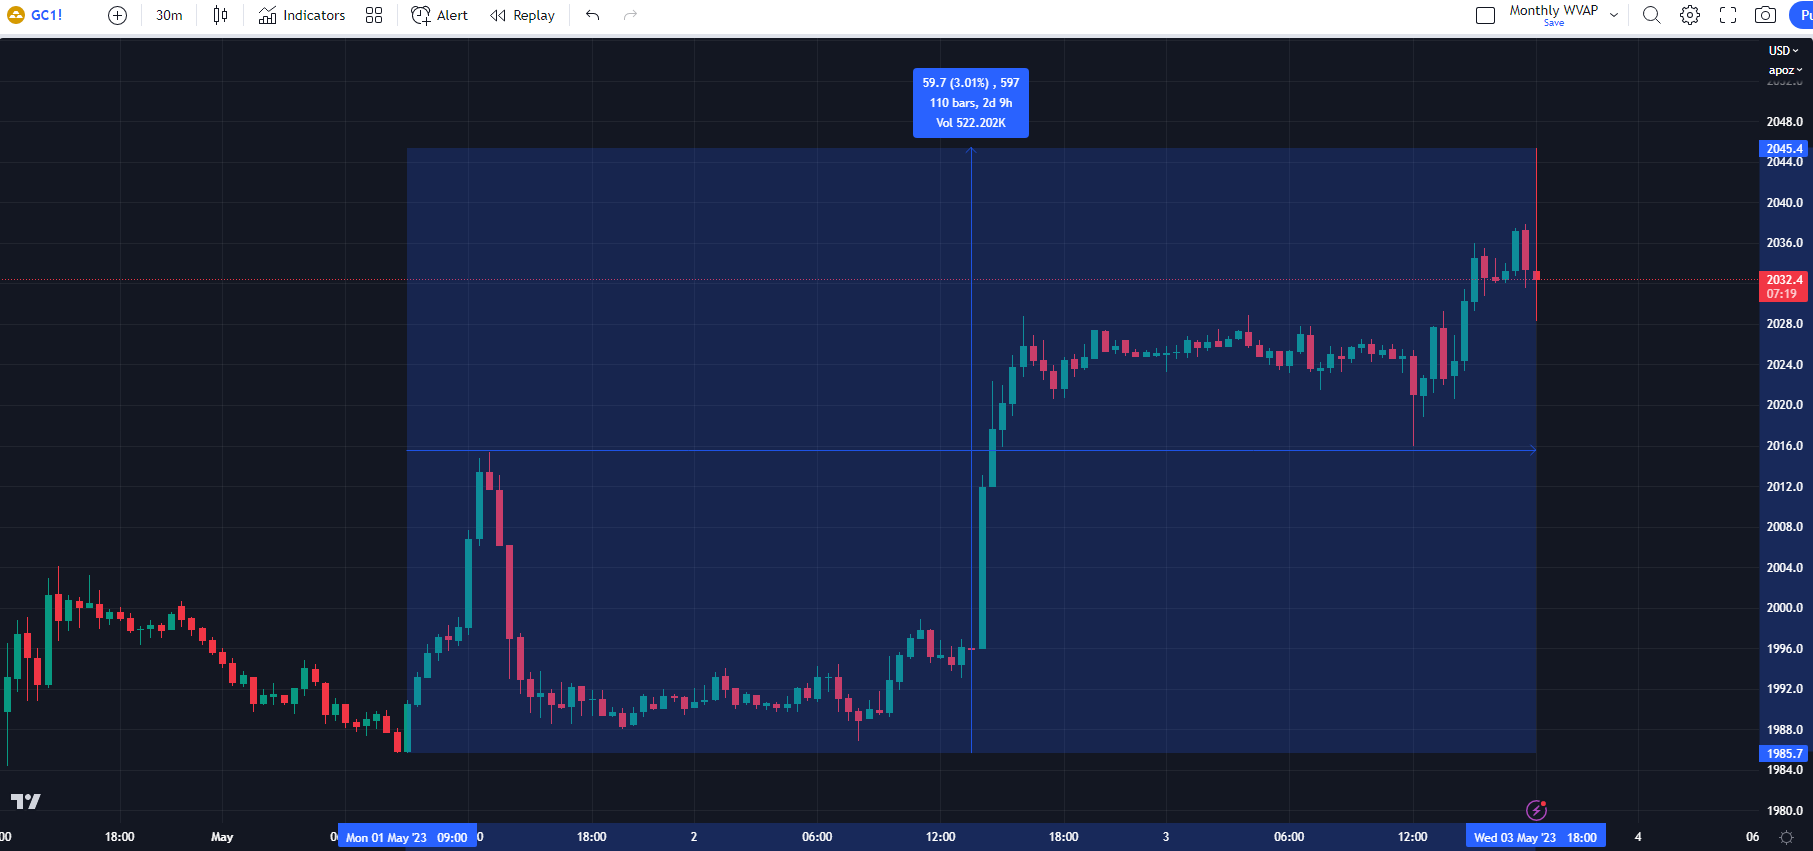
30 minutes chart of GC (Gold Futures), The volatility in May, source: author’s analysis
Technical analysis of gold
The fact that high volatility occurs in the price development of gold, the several possible support or resistance levels can be found in the chart. The monthly volume weighted average price (VWAP) set possible support in the area from $2,011.9 to $2,013.5. As it is seen from the end of the previous month (white ellipses), this area worked and is set by the previous monthly VWAP and currently developing VWAP indicator. The closest resistance could be above the $2,055 price level, which is set by last month’s highs from the 13th and 14th of April.
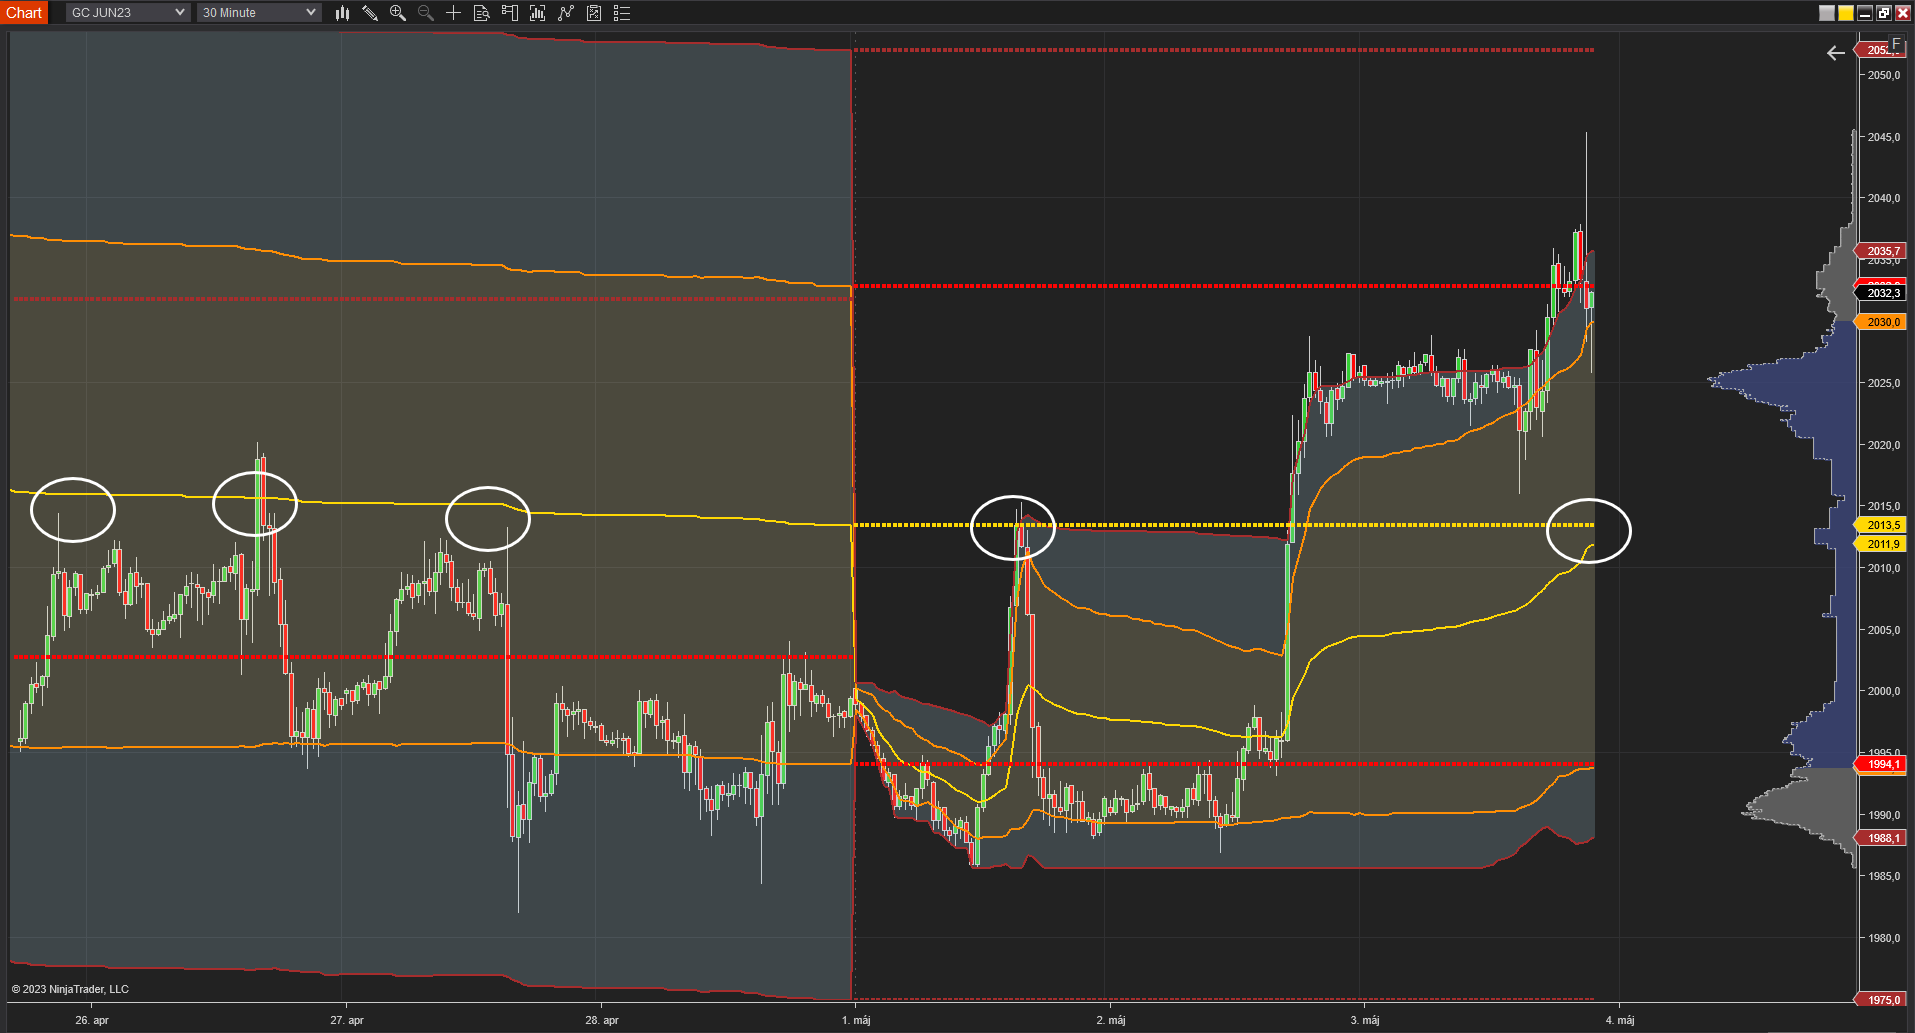
30 minutes chart of GC, The monthly VWAP, source: author’s analysis
Where to now?
The question can be answered after sobering up from “Fed’s Day”. Markets will decide if the information from the meeting and press conference is more dovish or not. In the case that a pause in rate hikes will be possible, USD can be weaker and therefore assets denominated in this currency can appreciate. In addition, 10 years treasury yield development will be another aspect of gold’s next move. A little dovishness is on the sight, but fundaments need to approve the current steps of the Federal Reserve Bank.


Comments
Post has no comment yet.