Divergence appears
Gold’s steam machine had elevated from the $1,800s territory up to the mid-$1,900s. In the uptrend, gold has gained more than 5% from the beginning of the year thanks to the inflation data in the US and the situation with the US treasury yields. The inflation data decreased from 7% to 6.5%, which is a good signal for monetary policymakers, to be not so hawkish about interest rates hiking.
Read more: Oil after inflation data – hurrah for the bulls!
Despite this, there could be a sign of losing steam for some time. If you compare the development between the price of gold and traded volume from futures contracts you will see a small contrast. There is a sign of divergence between the price and bid/ask cumulative delta. The bid/ask cumulative delta cumulates deltas of bid/ask volume traded in every measured session. For example, in a 1-hour timeframe, the indicator cumulates deltas from each hour.
The situation is that the price created higher highs in the chart, but the cumulative delta shows lower highs. That is a divergence between the price and trading volume, meaning the volume does not back the price. The chart below shows this divergence.
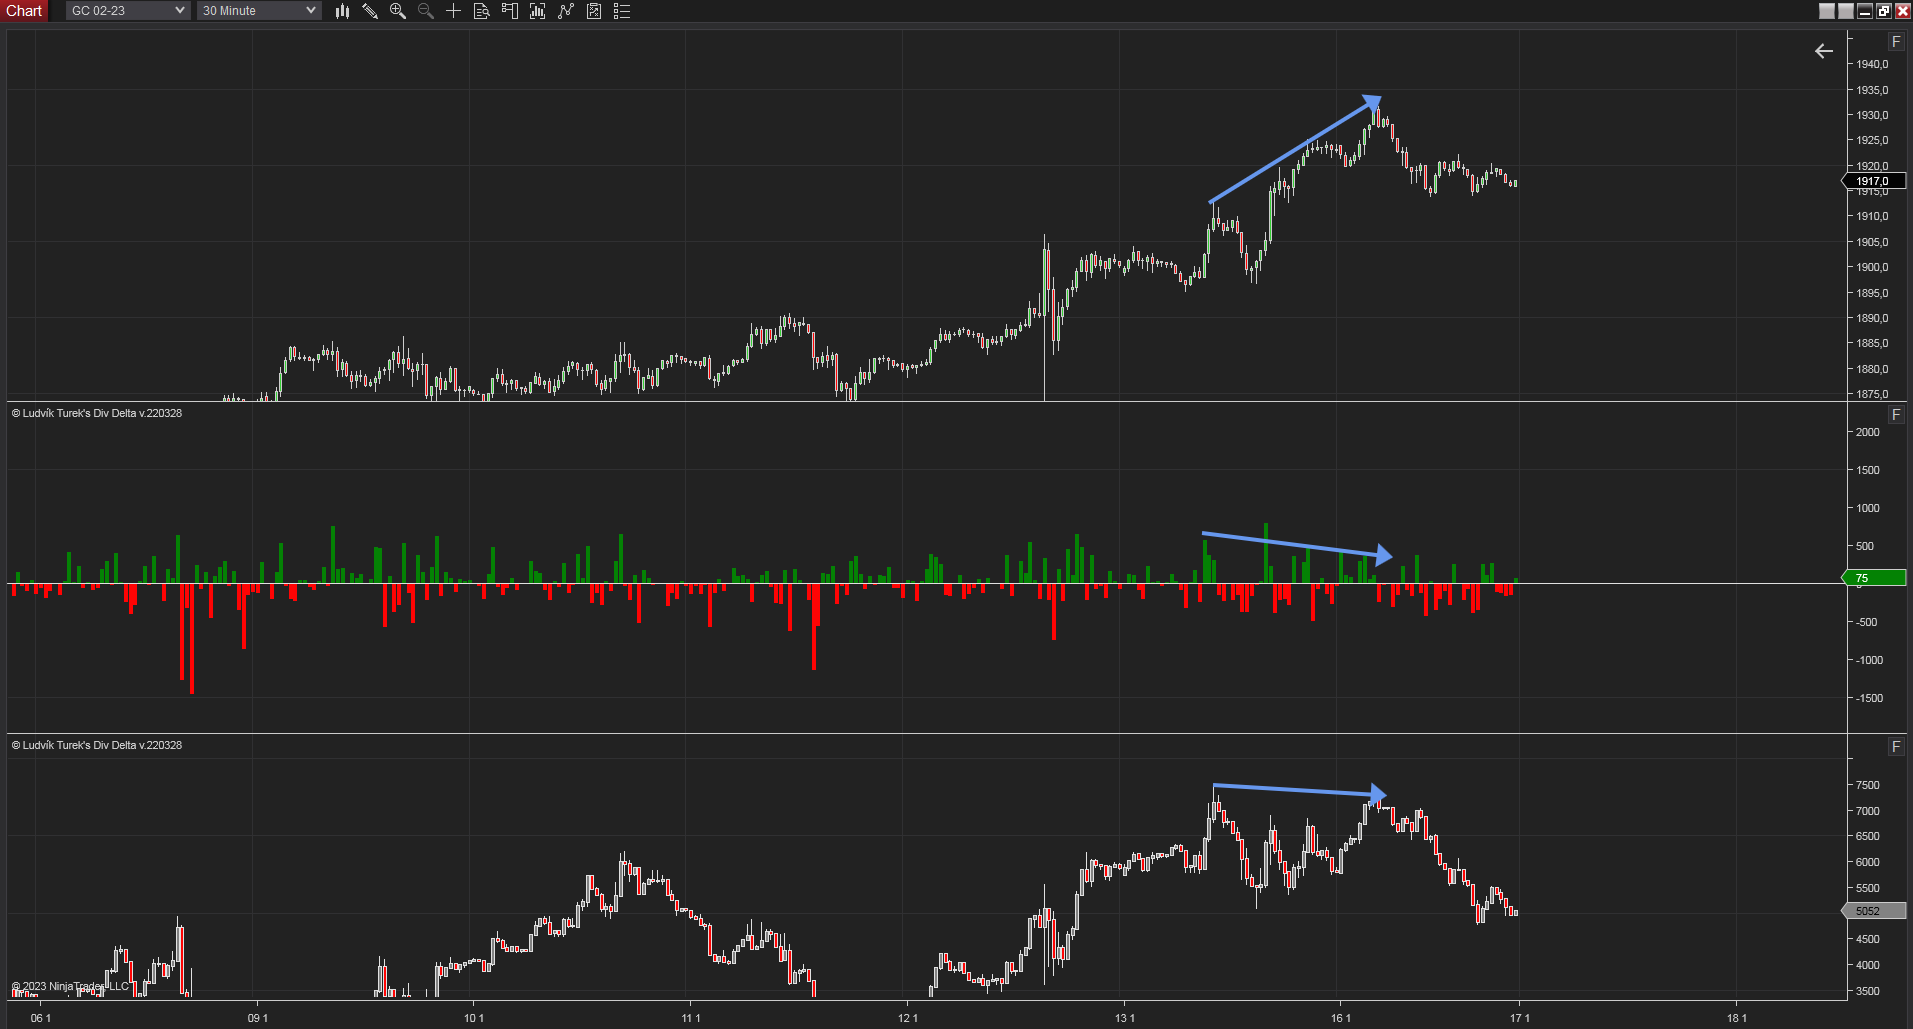
30 minutes chart of GC (Gold Futures), Divergence delta, source: author’s analysis
Lower inflation keeps the sentiment positive
Lower inflation from the US keeps the sentiment in positive territory. The less pressure on interest rates affects the US dollar which decreases against its counterparts. Gold included. Positive sentiment is clearly seen in the development of the commodity, but a small sign of divergences between volume and price starts to appear.
Related: EUR/USD defends 9-month highs, stays above 1.08
In the case of the south way for gold, the closest level of interest could be at $1,906.1, representing 1st standard deviation of monthly VWAP (Volume Weighted Average price). The next level could be in the area of $1,873.8 – $1,881.6, where is cumulated the highest traded volume of the current month.
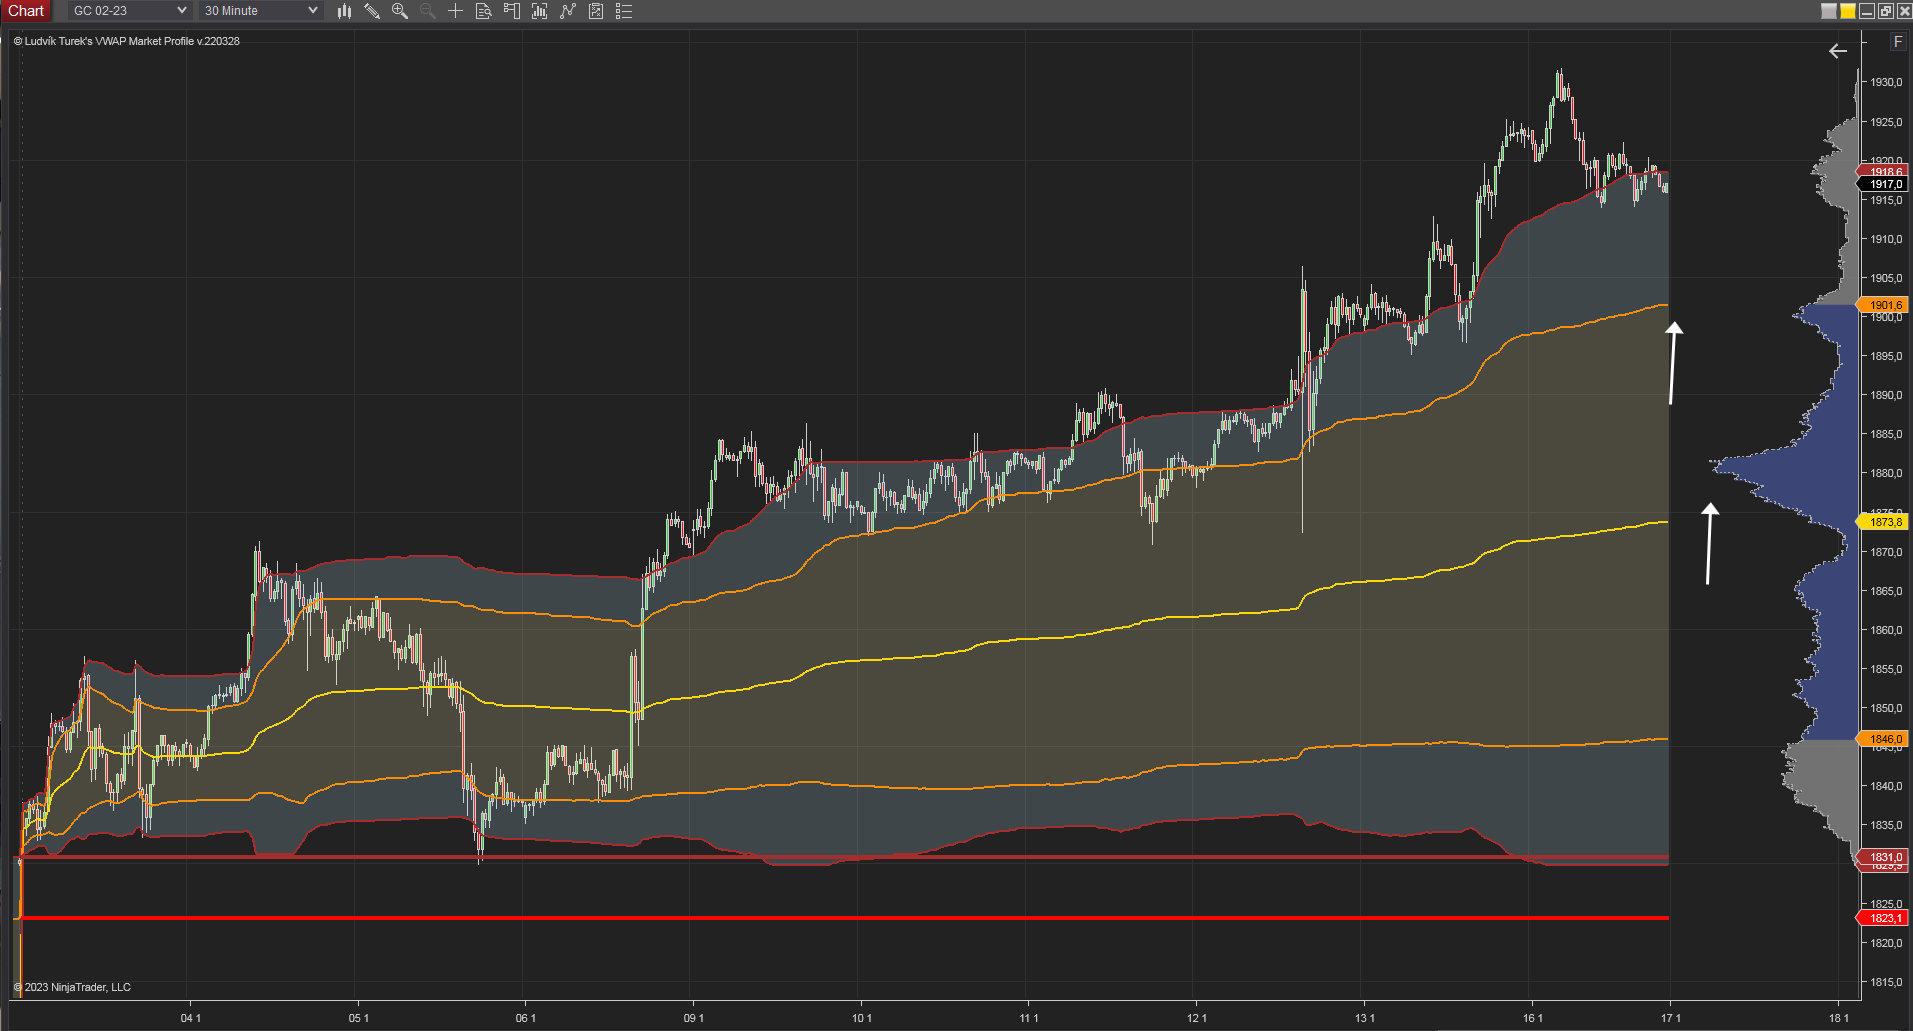
30 minutes chart of GC (Gold Futures), Monthly VWAP, source: author’s analysis
FOMC Meeting
The closest meeting of the Federal Open market Committee (FOMC) is set on the date of 31.01.-01.02.2023. The inflation data and unemployment are well known, and now it is the Fed’s turn to transform these data into the next steps of monetary policy. The biggest question definitely is, will the Fed hike the interest rates or not?


Comments
Post has no comment yet.