CME Futures showing gaps
The gap from 30th of May has already been filled with a soft touch of a wick. But we still have one gap that is not filled and that is at around 34 000 – 35 000 USD. This gap might be filled at the end of the cycle. It cannot be said for sure, when will that happen, but markets might be inclined to fill this gap at the end of this bear movement.
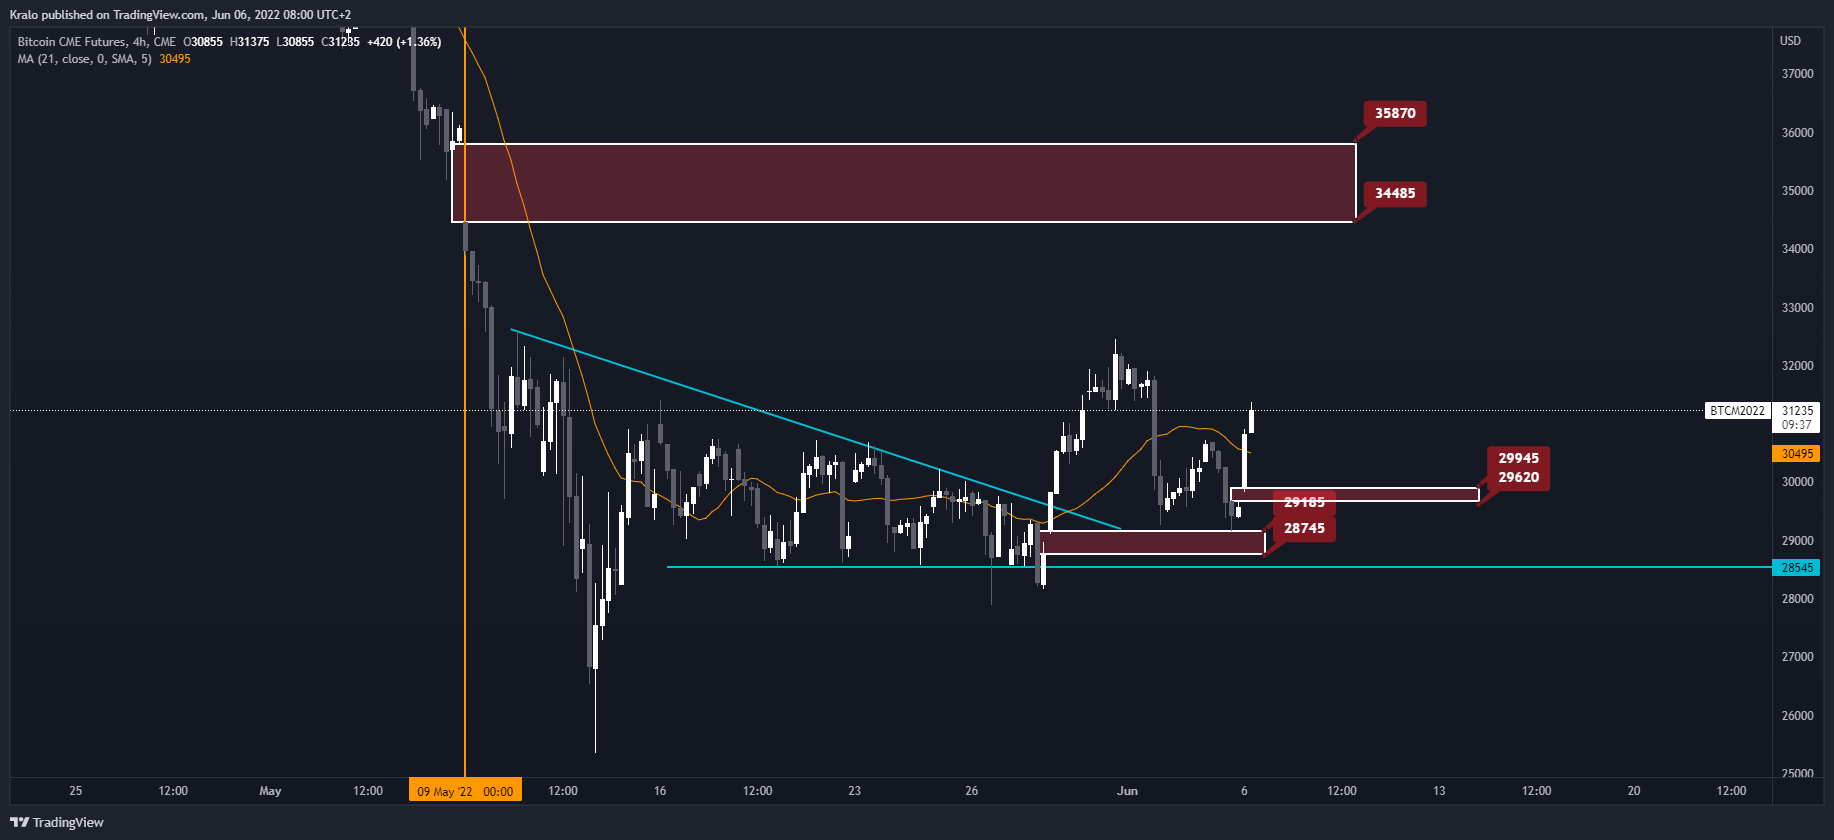
Bitcoin chart showing gaps, Source: Authors’ analysis, tradingview.com
Weekly chart suggest local bottom
The weekly chart suggests that we might be forming a local bottom. We can still go with a wick below the range, but overall, this is how local bottoms are usually created. This is a very common occurrence, when the price is moving around the bottom for some time and either range, channel or triangle can be spotted. This can mean that in the near future we might try to test 35 000 – 37 000 USD levels. In my view this is the biggest resistance that Bitcoin right now has, which is why I am not sure whether we can break through it at a first try.
You may also like: Are altcoins forming local bottoms?

1W Bitcoin chart, Source: Authors’ analysis, tradingview.com
Daily chart tiring traders
The daily chart shows that the current state of Bitcoin is a “war.” Usually, the range is supposed to tire out the traders and should take the stop losses. This means that wild wicks out of the range are exactly what this type of market wants. This however does not mean that we should not be pushing higher to the above-mentioned resistance.
Before this move occurs, the market needs to be strong enough to move. The scalpers and short term traders will be just waiting on side-lines for a bigger move, since they will already be tired of the constant stop loss hunts. We need to reach a phase of total boredom, where everyone will be just waiting. Once this happens, the liquidity will disappear from the market and the whales will have an easy job pushing the price of Bitcoin up.

1D Bitcoin chart, Source: Authors’ analysis, tradingview.com
Conclusion
I believe that Bitcoin looks like it is forming a local bottom and might be prone to a movement up. The question now remains, how far it can go and when will that happen.


Comments
Post has no comment yet.