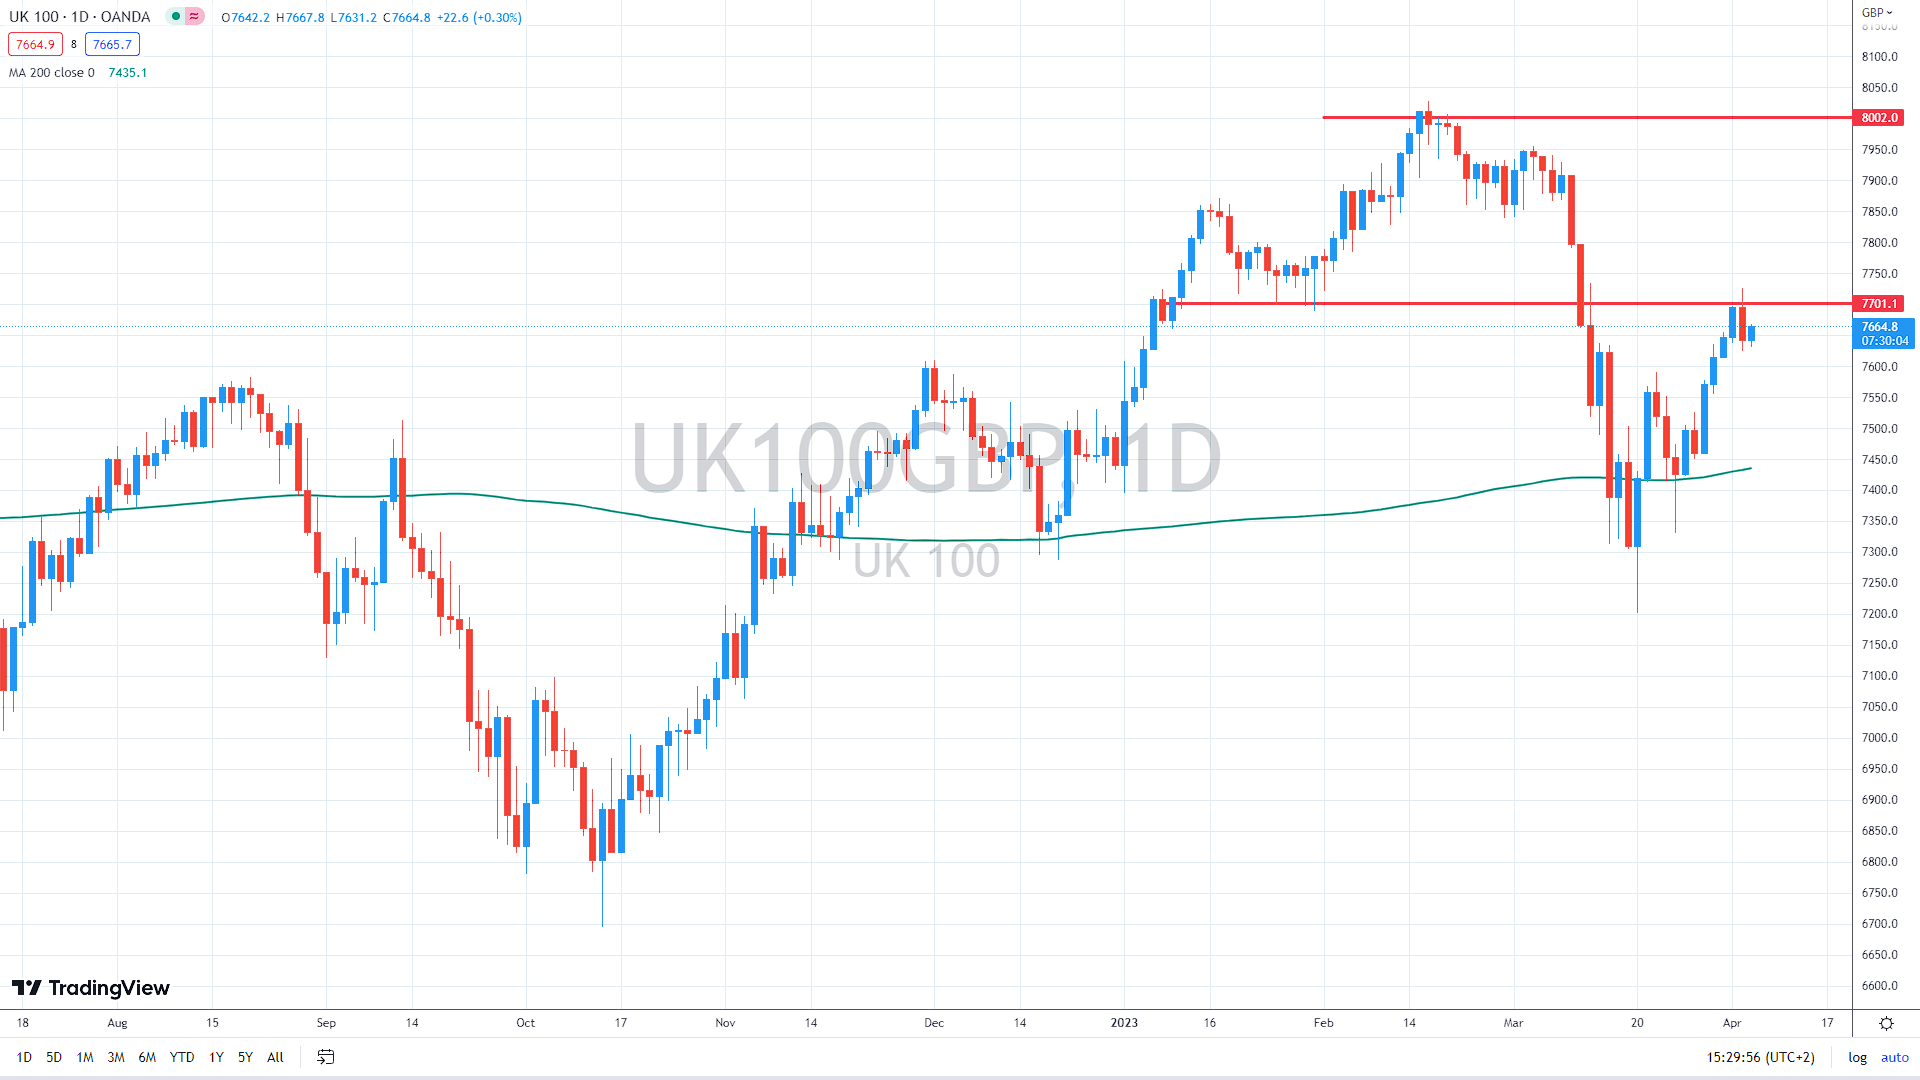
The British FTSE 100 index advanced on Wednesday, trying to breach the strong resistance of previous highs to confirm the bullish trend.
UK businesses are slightly more optimistic in April
52% of UK firms surveyed by the British Chambers of Commerce anticipate an increase in sales over the next 12 months, according to a quarterly poll. However, optimistic predictions began from a low foundation, as just 34% of respondents predicted increased sales in Q1 2023. Instead, 24% witnessed a fall in sales.
Another interesting topic: Financial sector stumbles, investors eye Dimon and El-Erian comments
The head of Research at the BCC stated that the poll revealed: “an improvement in business sentiment as political turmoil and inflationary pressures begin to ease.” In relation to inflation, BCC reported that, for the first time in two years, companies’ inflationary worries had dropped. 55% of firms reportedly want to hike prices, down from 60% a year ago.
UK industrial activity declines due to weakening demand.
According to a carefully followed poll by S&P Global/CIPS, industrial activity in the United Kingdom decreased in March as demand dropped. As a result, the seasonally adjusted purchasing managers’ index (PMI) for the UK manufacturing sector slipped to 47.9 in March from February’s seven-month high of 49.3.
This was below both the flash estimate and the consensus estimate of 48 and is the eighth consecutive month that the index has been below the neutral line of 50.
Dont miss: AUD/USD corrects Monday’s gains – will the 200-day average hold?
The research found that production has decreased in response to sluggish market demand and falling export orders. Consumer and intermediate goods sectors declined, while the output of investment goods increased for the second consecutive month.
Input inflation decreased to its lowest level since June 2020, while vendor lead times reduced to the greatest degree in the 31-year history of the study.
US data deteriorate further
A similar situation occurred in the US as well. For example, the latest ISM Purchasing Managers Index (PMI) data for manufacturing was 46.3, the lowest since May 2020. In addition, Myles Udland of Yahoo Finance noted that Monday’s data was the first time since 2009 when all ten sub-indexes indicated contraction, meaning that all indexes reported readings below 50.
You may also read: NZD/USD posts 2-mth highs after surprise RBNZ rate hike
Additionally, US manufacturing PMI also dropped to its lowest level since May 2020 in March, while US industrial orders sank for a second consecutive month, down 0.7% in February after falling 2.1% in January and 1.6% in December.
Moreover, February’s US JOLTS job opportunities decreased by 630,000 to 9.93 million, its lowest level since May 2021. The ratio of job postings to unemployment declined to 1.67 from 1.86, indicating some softening in labor demand, although the labor market is still well away from equilibrium.
Monday, Sam Stovall, chief investment strategist at CFRA Research, said, “We are inching closer to a recession.” He mentioned the decline in corporate earnings, which were approximately 4% lower in the fourth quarter of 2022 and are anticipated to have fallen 6.5% in the first quarter of 2023.
As previously mentioned, the first major resistance stands at January lows in the 7,700 region. If the price jumps above that level, we might see further squeeze higher, targeting the cycle highs at 8,000.
On the downside, the support is at 7,600, and if not held, we might see a decline toward the 200-day moving average (the green line) near 7,430.

FTSE100 index daily chart, source: author´s analysis, tradingview.com


Comments
Post has no comment yet.