The impact of soft data
The soft US data had a significant impact on the power of the US dollar. Better than expected NFP (Non-Farm Payrolls) and lower unemployment signal a stronger economy, but lower ISM signals potentially lower inflation pressure. These factors poured money into the energies, precious metals, and foreign currencies.
Read more: Wall Street continues the FOMC sentiment, ready for NFPs
The reason for moving money to these sectors is simple – declining USD and US Treasury Yields. The common knowledge is that higher interest rates support Treasury Yields and, for example, precious metals are hurt. This type of commodity does not have an interest and in the case of higher interest rates (and yields), gold and silver are less competitive. But soft data signals a “soft landing”, meaning less hawkish monetary policy. The possibility of not so sharp hike in interest rates flows optimism into the markets.
Crucial support ahead
Monthly futures data shows a very strong level close to $23.300. First is a monthly market profile. It is a Gauss function with a deviation of 70%. That means that the green area absorbs 70% of all volume from the session. And the yellow line signals the highest traded volume of the session. This level is named Point of Control and is at $23.270.
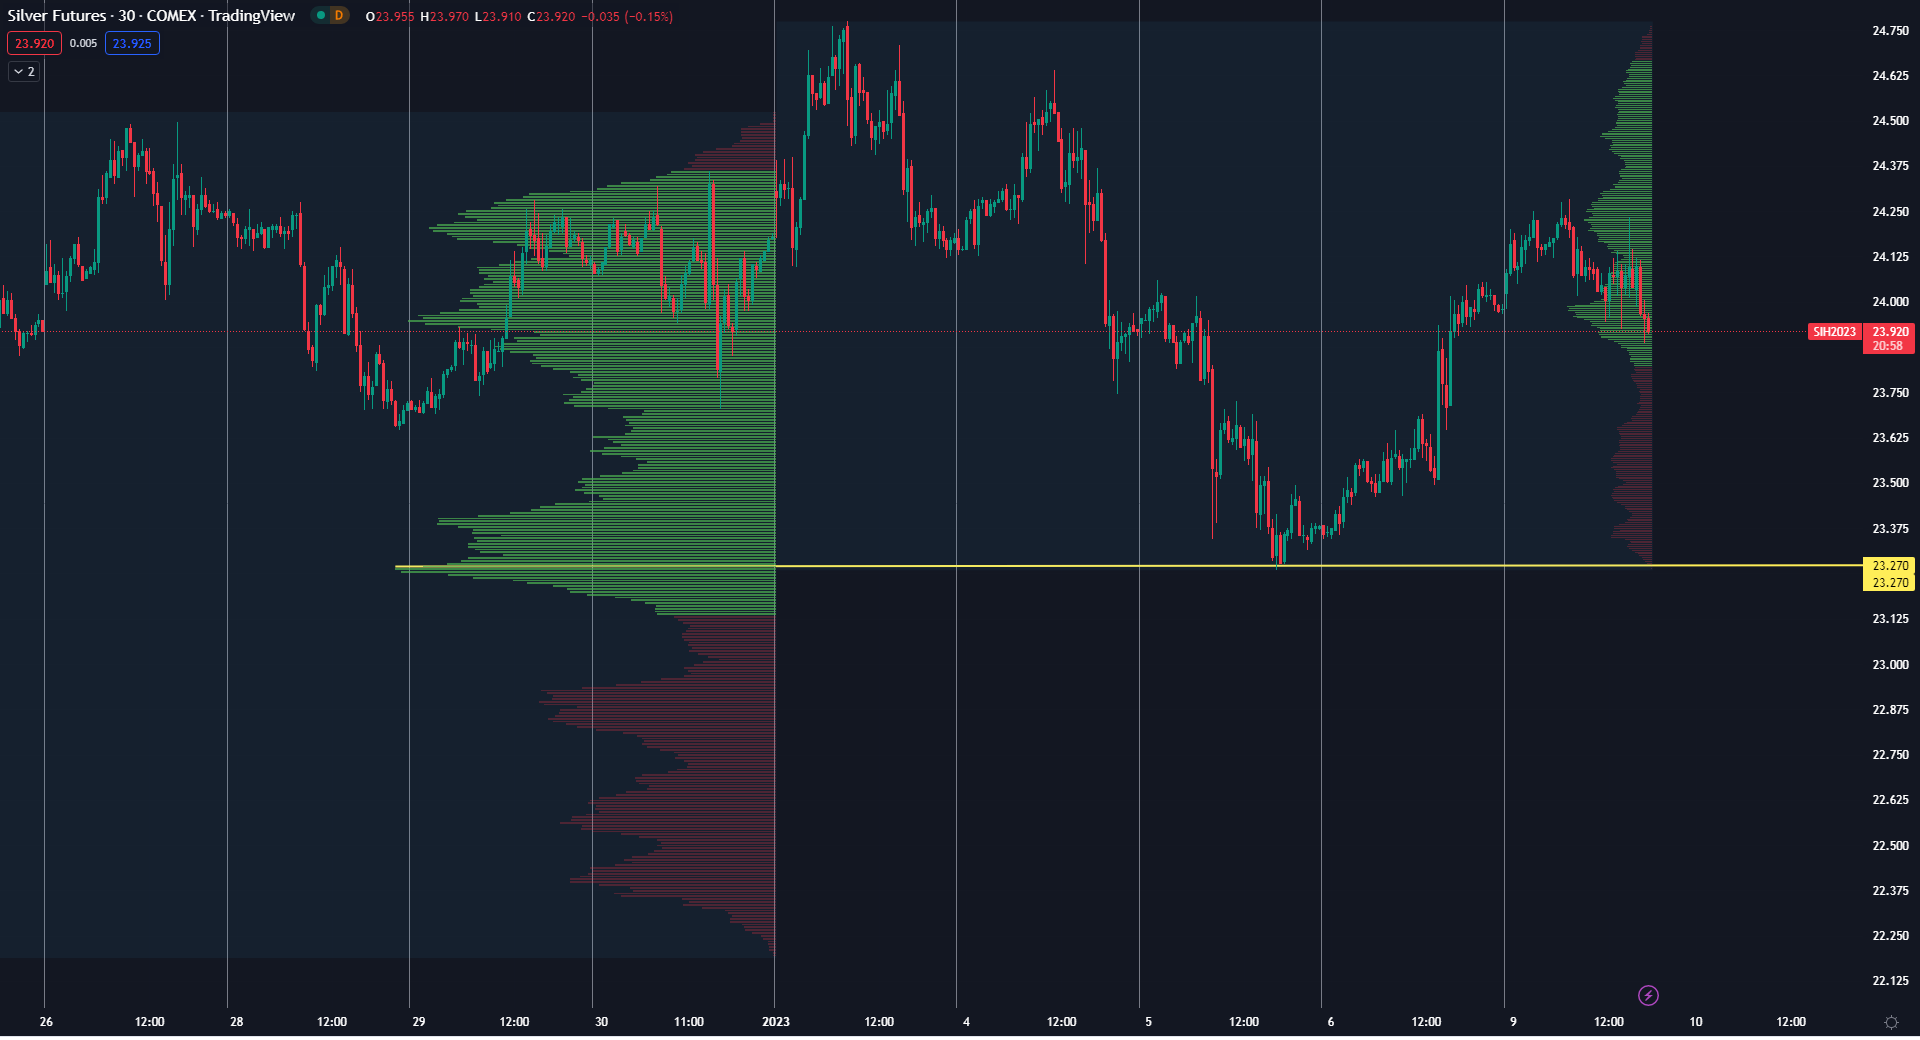
30 minutes chart of SI (Silver Futures), Monthly Market Volume Profile. Source: tradingview.com
Another level is from the Volume Weighted Average Price indicator which signals the average volume and the level from December 2022 ended at $23.313.
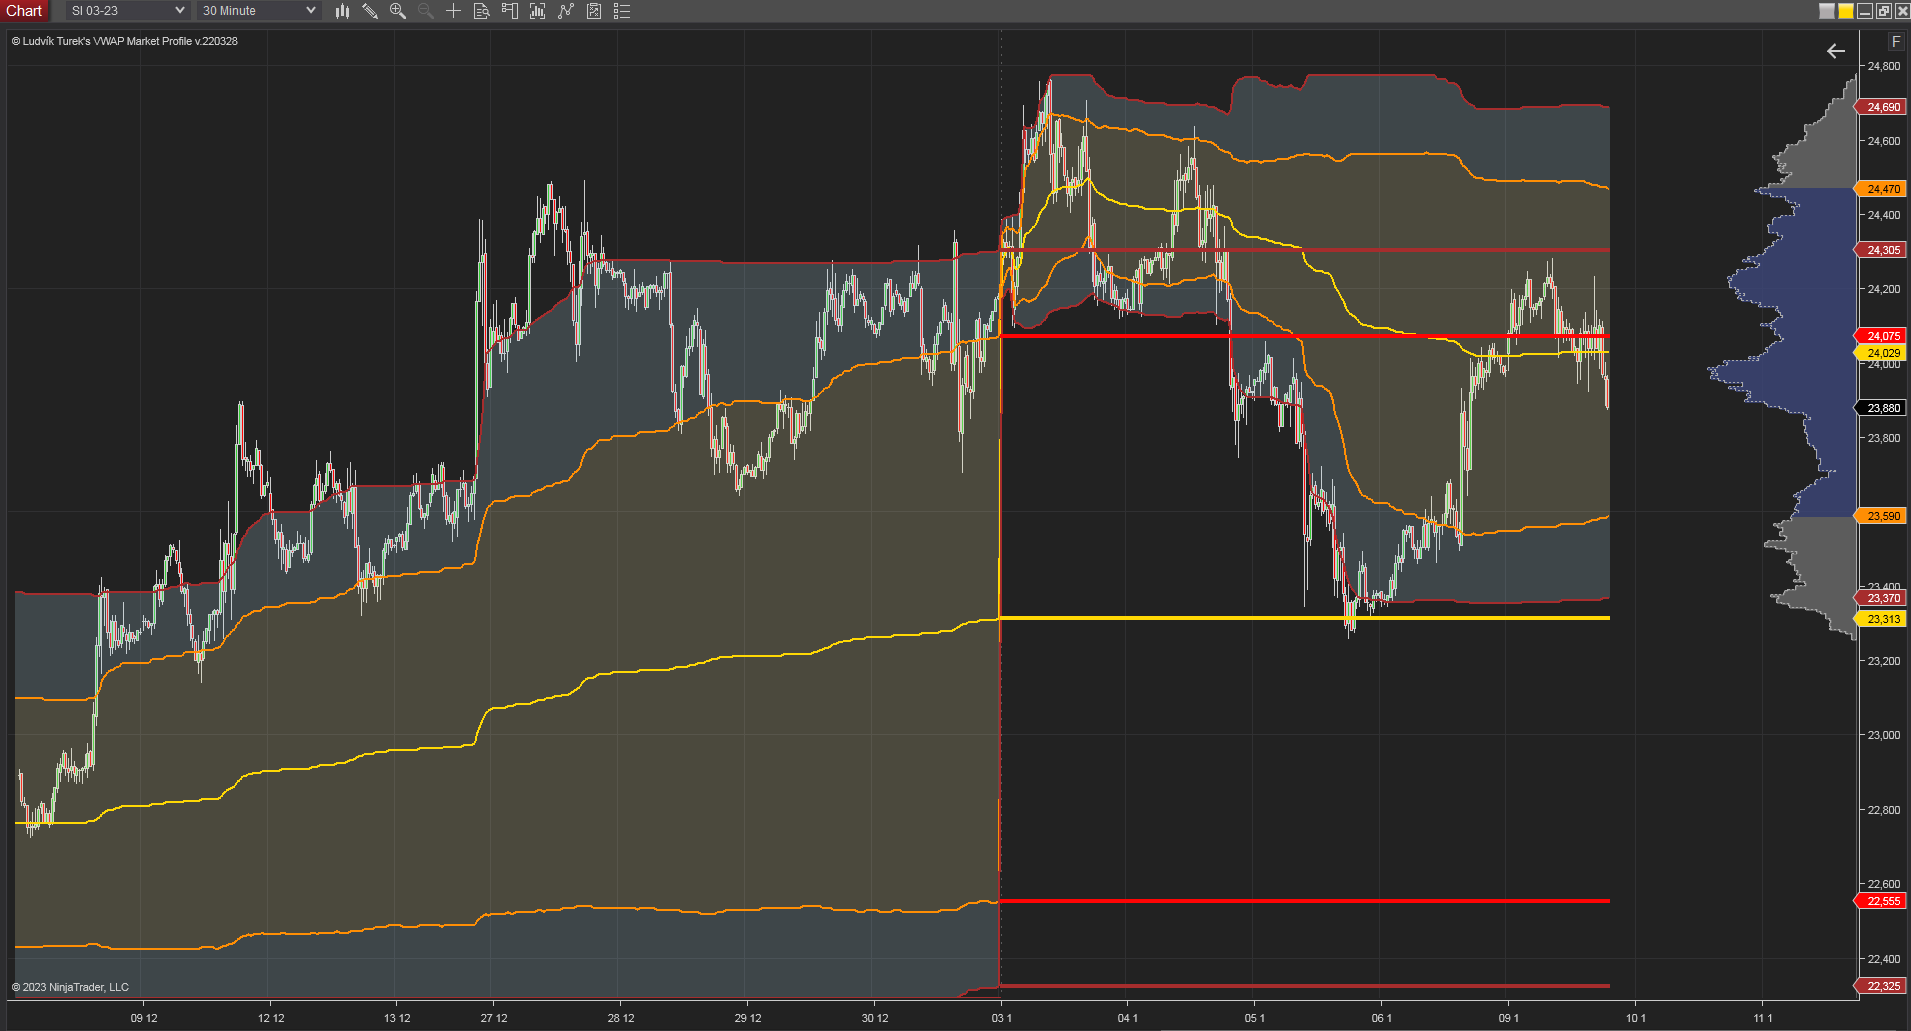
30 minutes chart of SI, Monthly VWAP level, source: author’s analysis
It is clearly seen that mentioned area around $23.300 was tested last Thursday and bounced back to a $24 territory. It seems that this level is support for the next price development. In case that the price will go under this level and confirms its pricing there, the support will become the resistance, and the development could decline lower.
We analyzed also: ECB’s new blog shashes crypto, confirms the arrival of CBDCs
Inflation on the horizon
This week is definitely targeted at the inflation data from the US. Data will be released this Thursday, with the previous number of 7.1% on a YoY basis. Expectations are 6.5%, but everything under 7% can shoot the price of precious metals to the moon. Lower inflation data can signal that Fed’s monetary policy works and possibly no big hikes will occur in the close future.


Comments
Post has no comment yet.