The horrific weekly chart
Looking at the weekly chart, the price is very far from 30 000 USD and this support, which held us for more than a year, broke.
Read also: Crypto news summary: 19-25 June
For the first time in its history, Bitcoin has fallen below the ATH of the previous cycle (2017 ATH at 20 000 USD). This level was once again a very strong support which seems to be holding pretty well even though Bitcoin has fallen below it few times. Yet, the weekly chart shows that the whole 2021 bull market has been erased.

1W chart of Bitcoin, Source: Author’s analysis, tradingview.com
Zooming in to 1D chart
When zoomed in to 1D chart, the price is clearly below the trendline as well as the MA21. This means that we just cannot be very bullish yet. However, the biggest liquidity for this chart is at the levels of 28 000 to 30 000 USD. Due to its importance, its is logical to expect that the market will move there sooner or later.

1D chart of Bitcoin, Source: Author’s analysis, tradingview.com
The chart clearly shows that the downtrend has been very strong and that possible retracement might be on its way. There is not a single asset class that can be constantly moving down. Once the retracement or even reversal comes, we should be looking at the 28-30K resistance as one of the most important levels to break on the way up.
You may like: Crypto outlook: Polygon, Chainlink, Polkadot and Cronos
No signs of significant movement at 4h chart
Zooming even more in, the range structure is showing, which is similar to few previous instances. The range structure in the chart usually signifies continuation of the strong movement. The markets tend to be balanced in general which means that after a strong move, a bit of boredom is expected. This is very common for Bitcoin. Unless we break out of this range, Bitcoin will only move sideways and the market as such will not move significantly.
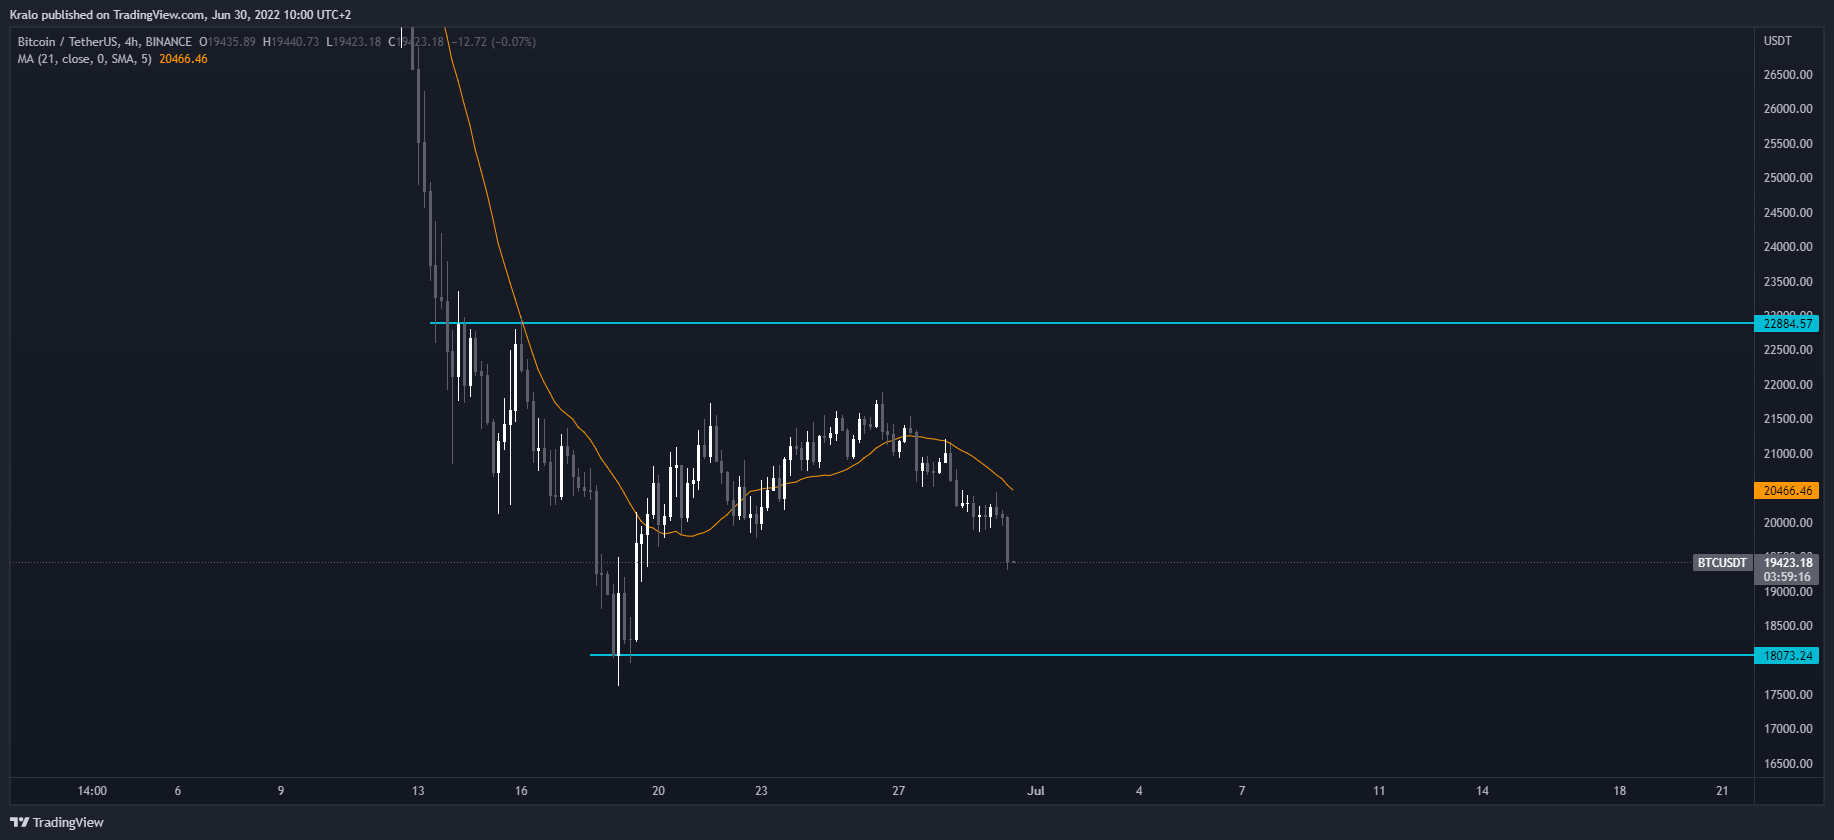
4h chart of Bitcoin, Source: Author’s analysis, tradingview.com


Comments
Post has no comment yet.