We described the difference between EPS development and the development of “net income” in the previous chapter on buybacks. Due to the increasing of buybacks, the number of “outstanding shares” is decreasing, so we can see EPS growth even with the stagnation of net income. And so, there may be a mistaken assumption that the company’s profit is growing.
Source: Own Calculation
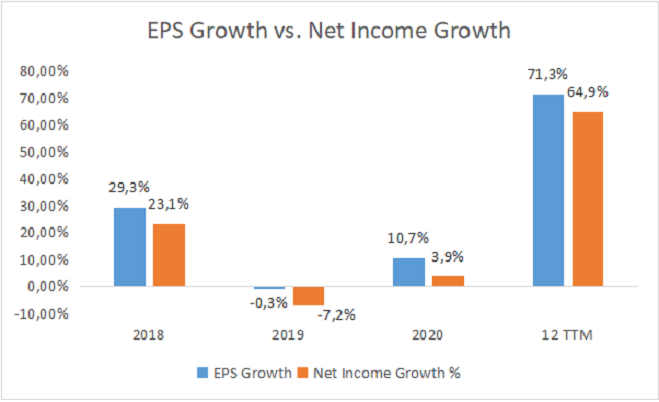
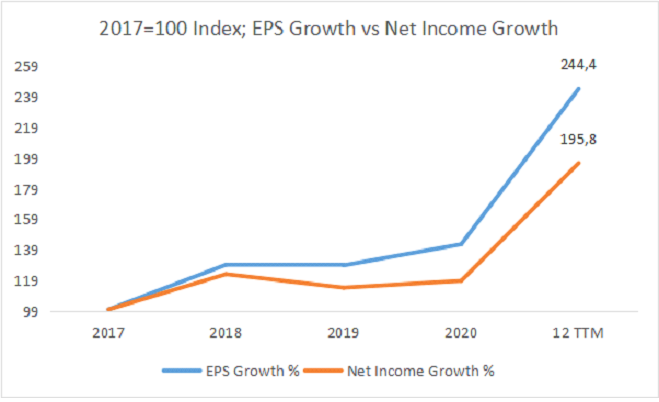
Above, you can notice that EPS correlates with “Net Income” growth, but it grows faster and dampens the downturn with lower sales. Long-term buybacks reduce the number of outstanding shares, which is why EPS and Net Income are slightly different. Below we made an indexed chart that shows the difference from 2017 (2017 = 100, we indexed the data as of this date). Its like a cumulative increase from 2017 – you can compare the change of EPS (which is impacted due to buybacks) vs. Apple´s net income growth development.
Source: Own Calculation
Since 2017, this difference has been up to 48% (244.4 – 195.8). While EPS has grown by 144.4% since 2017 (Dec 12 TTM), Net Income “only” by 95.8%. These are impressive numbers, whether one or the other growths, proving that Apple (AAPL) is an excellent company with significant profitability. However, you can see the image of misinterpretation here because the media mainly shows EPS. However, big players care about detailed structure, but retail investors can easily avoid it. In addition, we can also see that 2021 is a crucial year for Apple in profitability. In terms of profitability, it did not grow much because from 2017 to 2020, net profit increased only 18.7%, which is not so much for the company at such high valuations.
We will deal with issues later, either in the case studies or in a chapter describing the “Income Statement” in more detail. However, for curiosity, we present graphs that confirm these differences.

Comments
Post has no comment yet.