If we monitor and compare individual data, we should not forget to watch the percentage change. Here we calculate it very quickly. For example, if we wanted to determine the growth of apple sales in 2021, the formula would look like this: (revenues 2021 – revenues 2020) / revenues 2020.
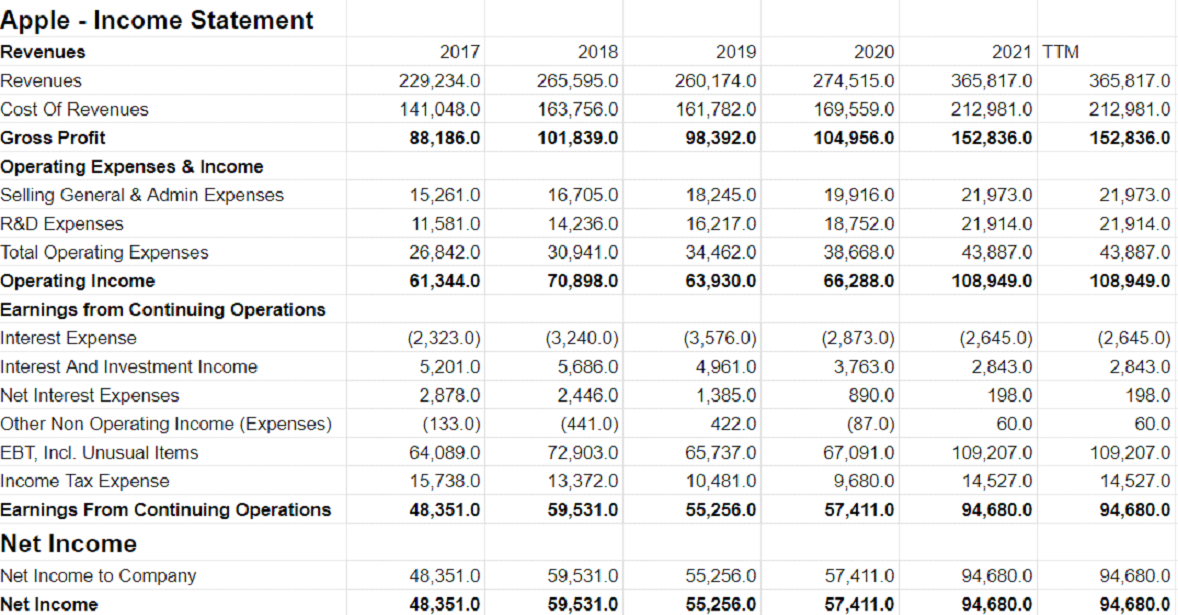
Source: SeekingAlpha via own calculation
In the following graphs, we can see these critical metrics in the graphical view. It is also essential to follow the trend, investigate why these phenomena occurred (growth/decline), etc. You may be wondering why we don’t mention the EPS indicator. This is because we would much rather recommend following the development of the “Net Income” item, which will give us a more realistic picture of the company’s development.
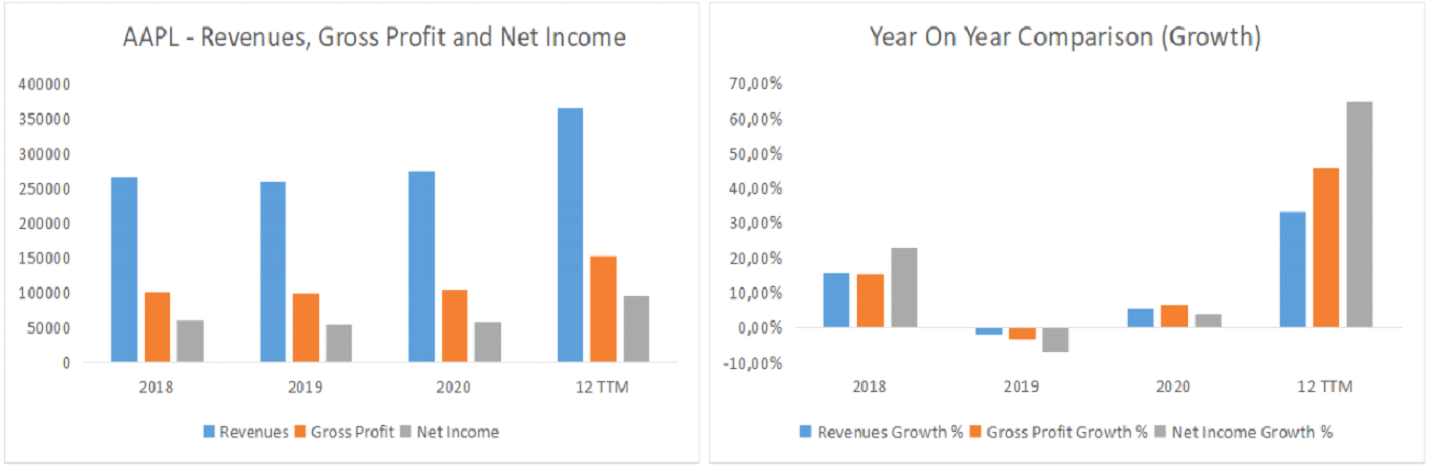
Source: Own calculation

Comments
Post has no comment yet.