There are many uncertainties and tensions in global markets (inflation, rates hikes, eastern Europe political tensions…) that could increase the volatility of this commodity. The current price of XAG/USD – Silver Spot US Dollar is 23.57 (February 11, 2021). So, let’s move on to statistical and technical analyzes.
STATISTICAL ANALYSIS
Based on a long-term analysis of historical data, the average positive and negative daily returns are approximately 1.30% and -1.36%, respectively. The estimated daily return in both directions based on their probability of occurrence is 0.67% and -0.62%. Friday´s return was 1.67%, which is slightly below the first standard deviation. Our scoring is currently positive (1) for the month-on-month change and 1 for price indexation. It means that we are in a slightly positive phase of the cycle. Both scorings range from -3 up to 3. The development of the estimated cycles based on our analytical system is shown in the following chart.
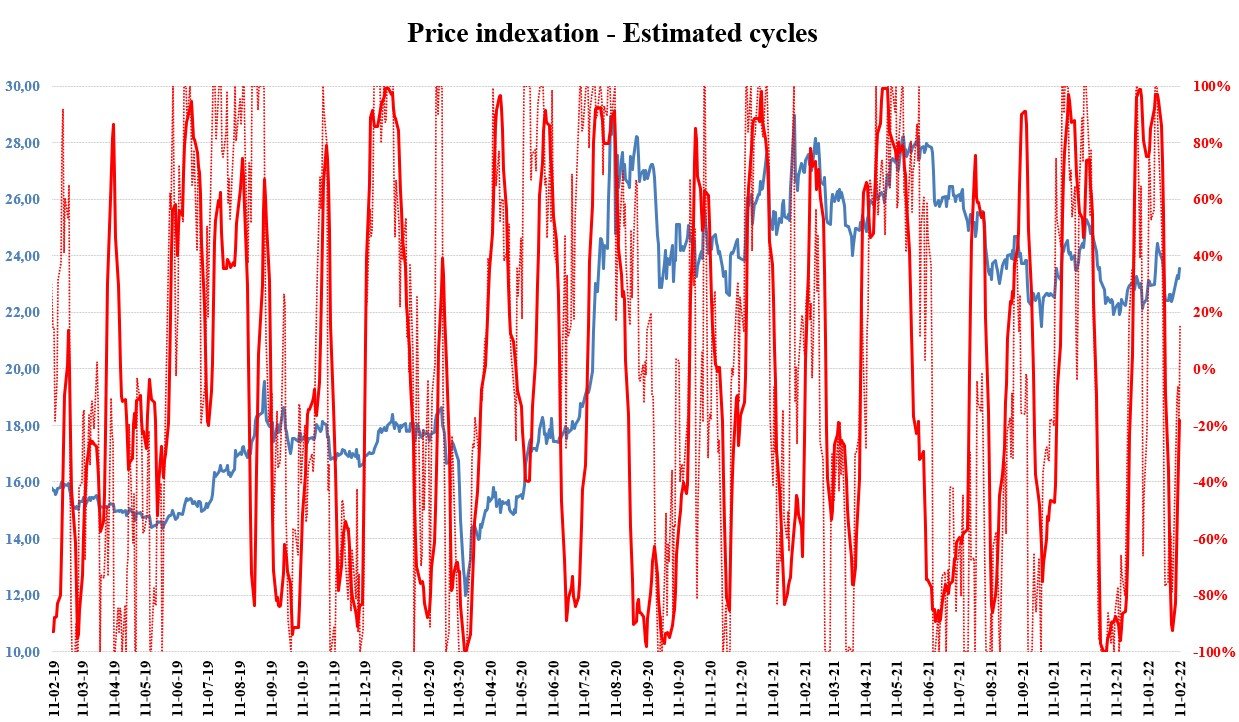 Source: WALFIR
Different moving averages (MAs) help us better identify trends across multiple time frames. We use 3 basic MAs to find out which sentiment dominates each horizon. The purple line represents the monthly , the green line the 6 months and the yellow line the annual moving average. According to the monthly MA, XAG/USD is in a bearish sentiment. Short-term moving averages could support the market price.
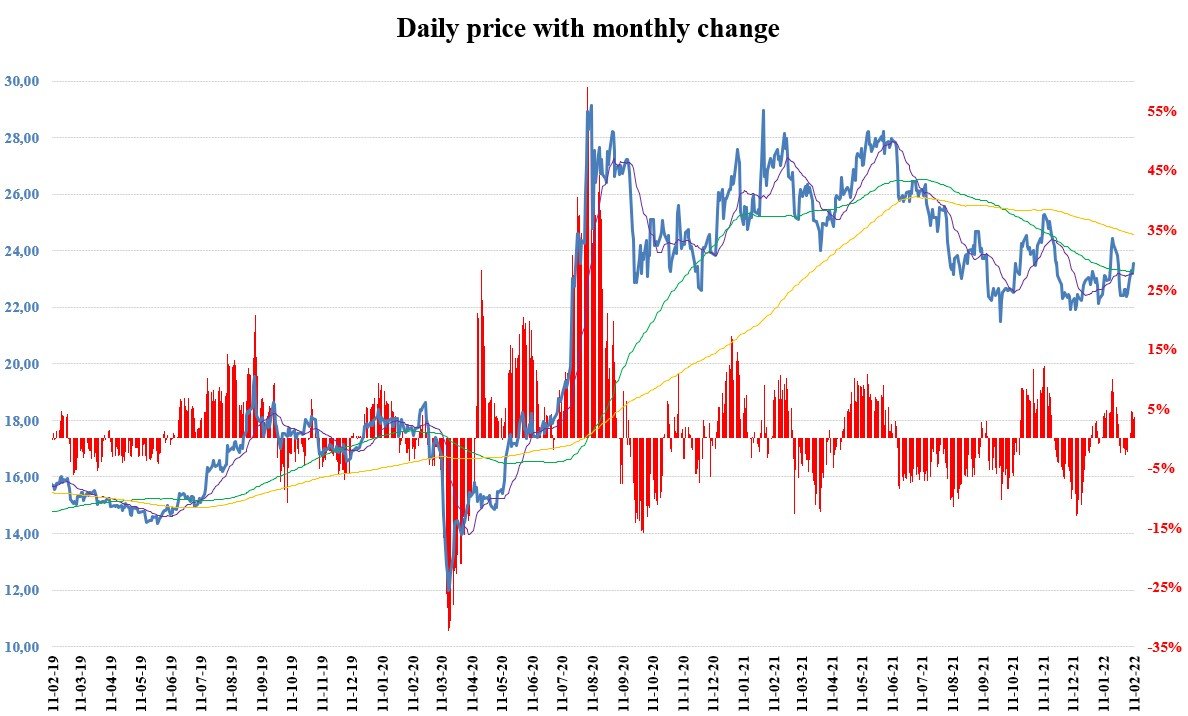
Source: WALFIR
Since our last analysis, there have been more rising trends, with a maximum of 4 consecutive days. The total maximum for the upward trends for the last 3 years is 5 days. Downward trends have not exceeded more than 5 consecutive days in recent months. The total maximum for the last 3 years is 8 days. We could use the average long-term ATR (Average True Range) obtained from daily data (2.46%) to estimate Stop Loss orders for our positions. The current value is 3.16%, which is below average. Approximately 90% confidence interval (return between -3.00% and 3.00%) is shown in the histogram below by a red rectangle.
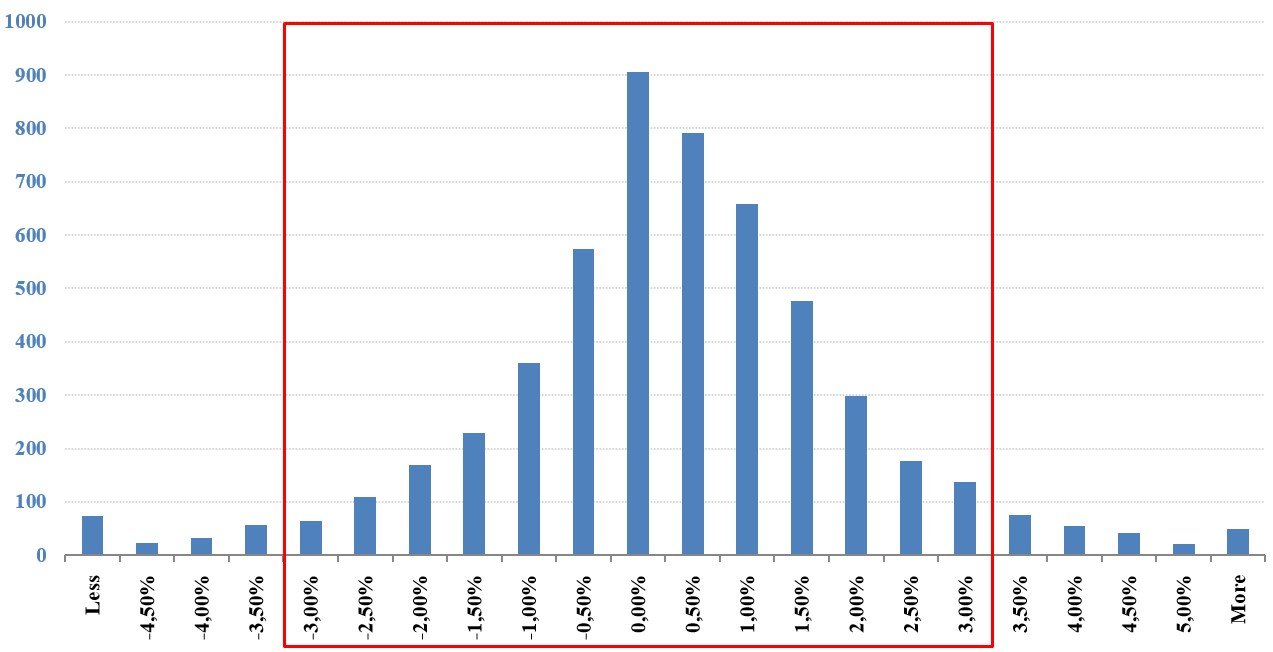
Source: WALFIR
We could use the last decile of low to high returns (4.50% ) to estimate Profit Targets, as shown in the chart below.
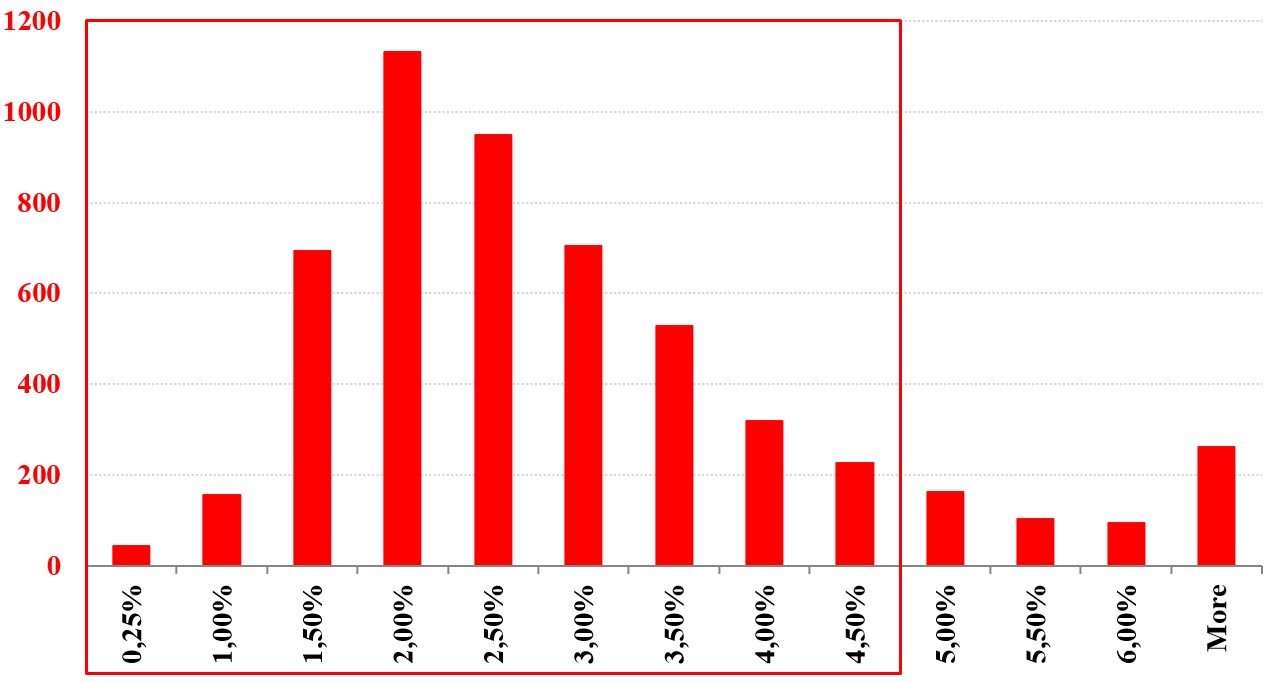
Source: WALFIR
TECHNICAL ANALYSIS
The basic technical analysis points to the sideways development in recent months. Recently, however, there has been a rebound in the lower part of the demand zone (green rectangle), where is also the Fibonacci retracement level of 38.20% and the short-term moving average. Both could currently act as market price support. In addition, the XAG/USD is again trying to move up from the zone. However, the long-term moving average and psychological level at 25.00 could be strong short-term resistance for the bulls.
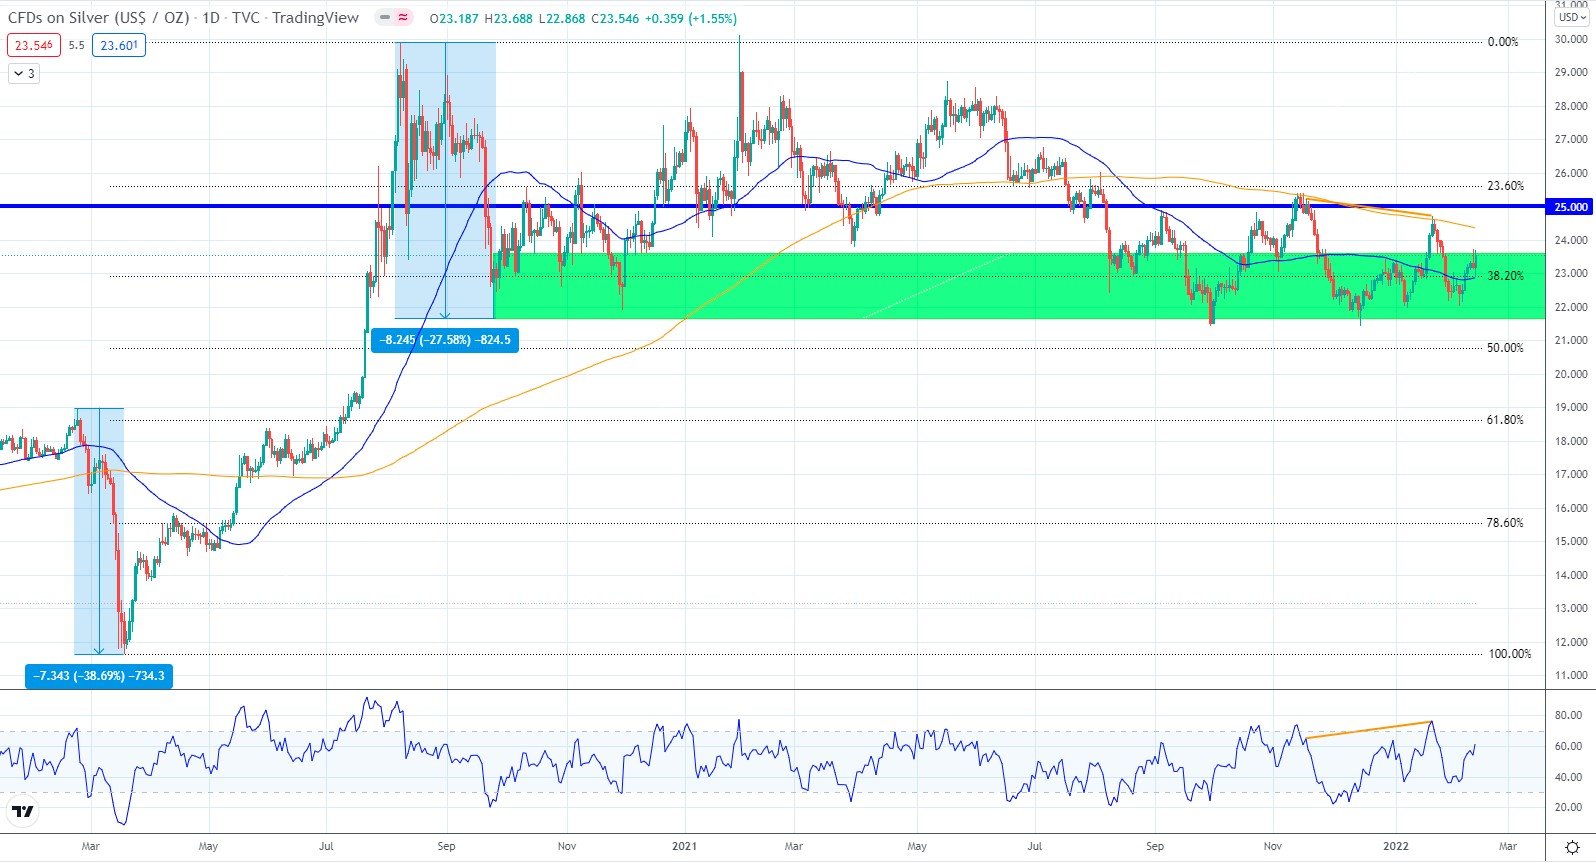
Source: TradingView


Comments