Oil prices have been declining for about half a year, temporarily bottoming out at $70, which was our target when the price was $87.5. WTI Crude oil dropped by 46% in that time but failed to go below $70, which serves as local support.
Where is oil headed?
It’s a fact that oil prices have already peaked, with WTI oil at around $130 in early 2022. However, current technical analysis suggests it could move higher. This is the first time in almost two years that the commodity approached the 200-day moving average (EMA200).
Related article: Investors are too bearish – time to be a contrarian?
Moreover, a round number of $70 with a bullish divergence helped oil to jump higher. It is already up more than 10% in less than two weeks, and the further price increase is highly likely looking at smaller timeframes.
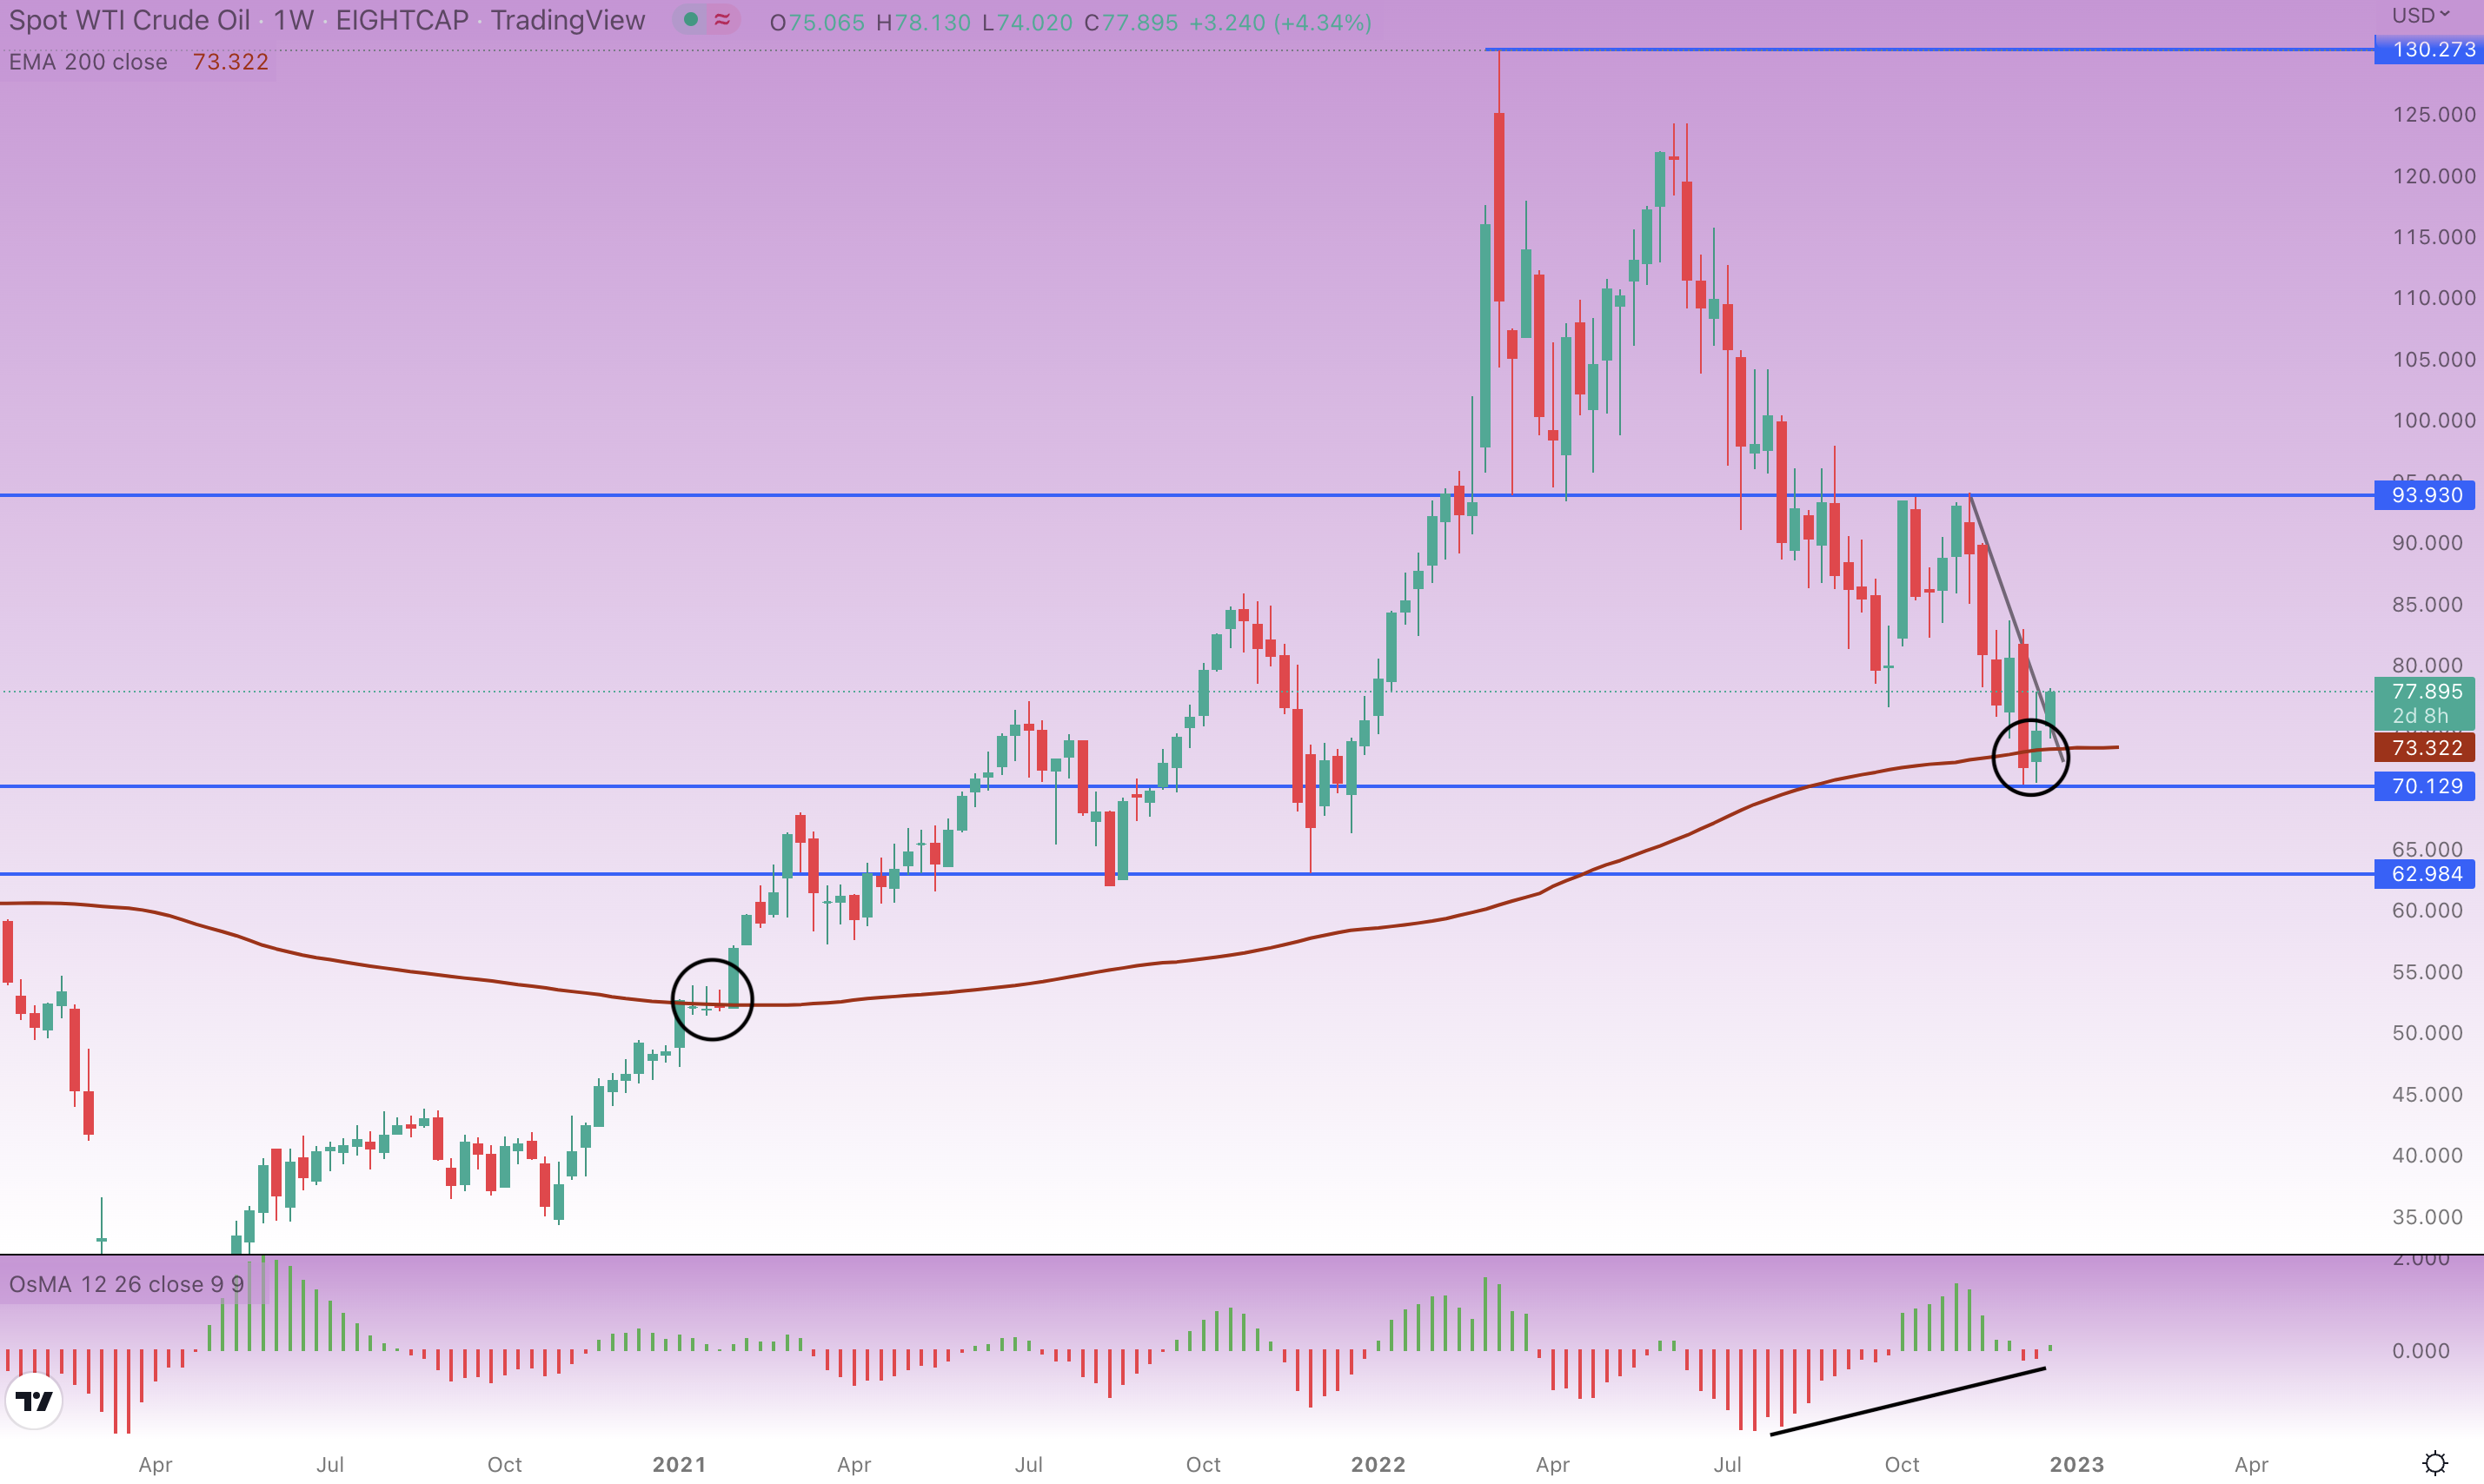
WTI Crude oil weekly chart, author’s analysis, source: tradingview.com
After bottoming out at $70, oil broke an important trend line that kept the downtrend going. Now it is possible we will see the commodity rise above $80, or even to the resistance of $83. It is currently forming a higher high (HH) before another move to the downside.
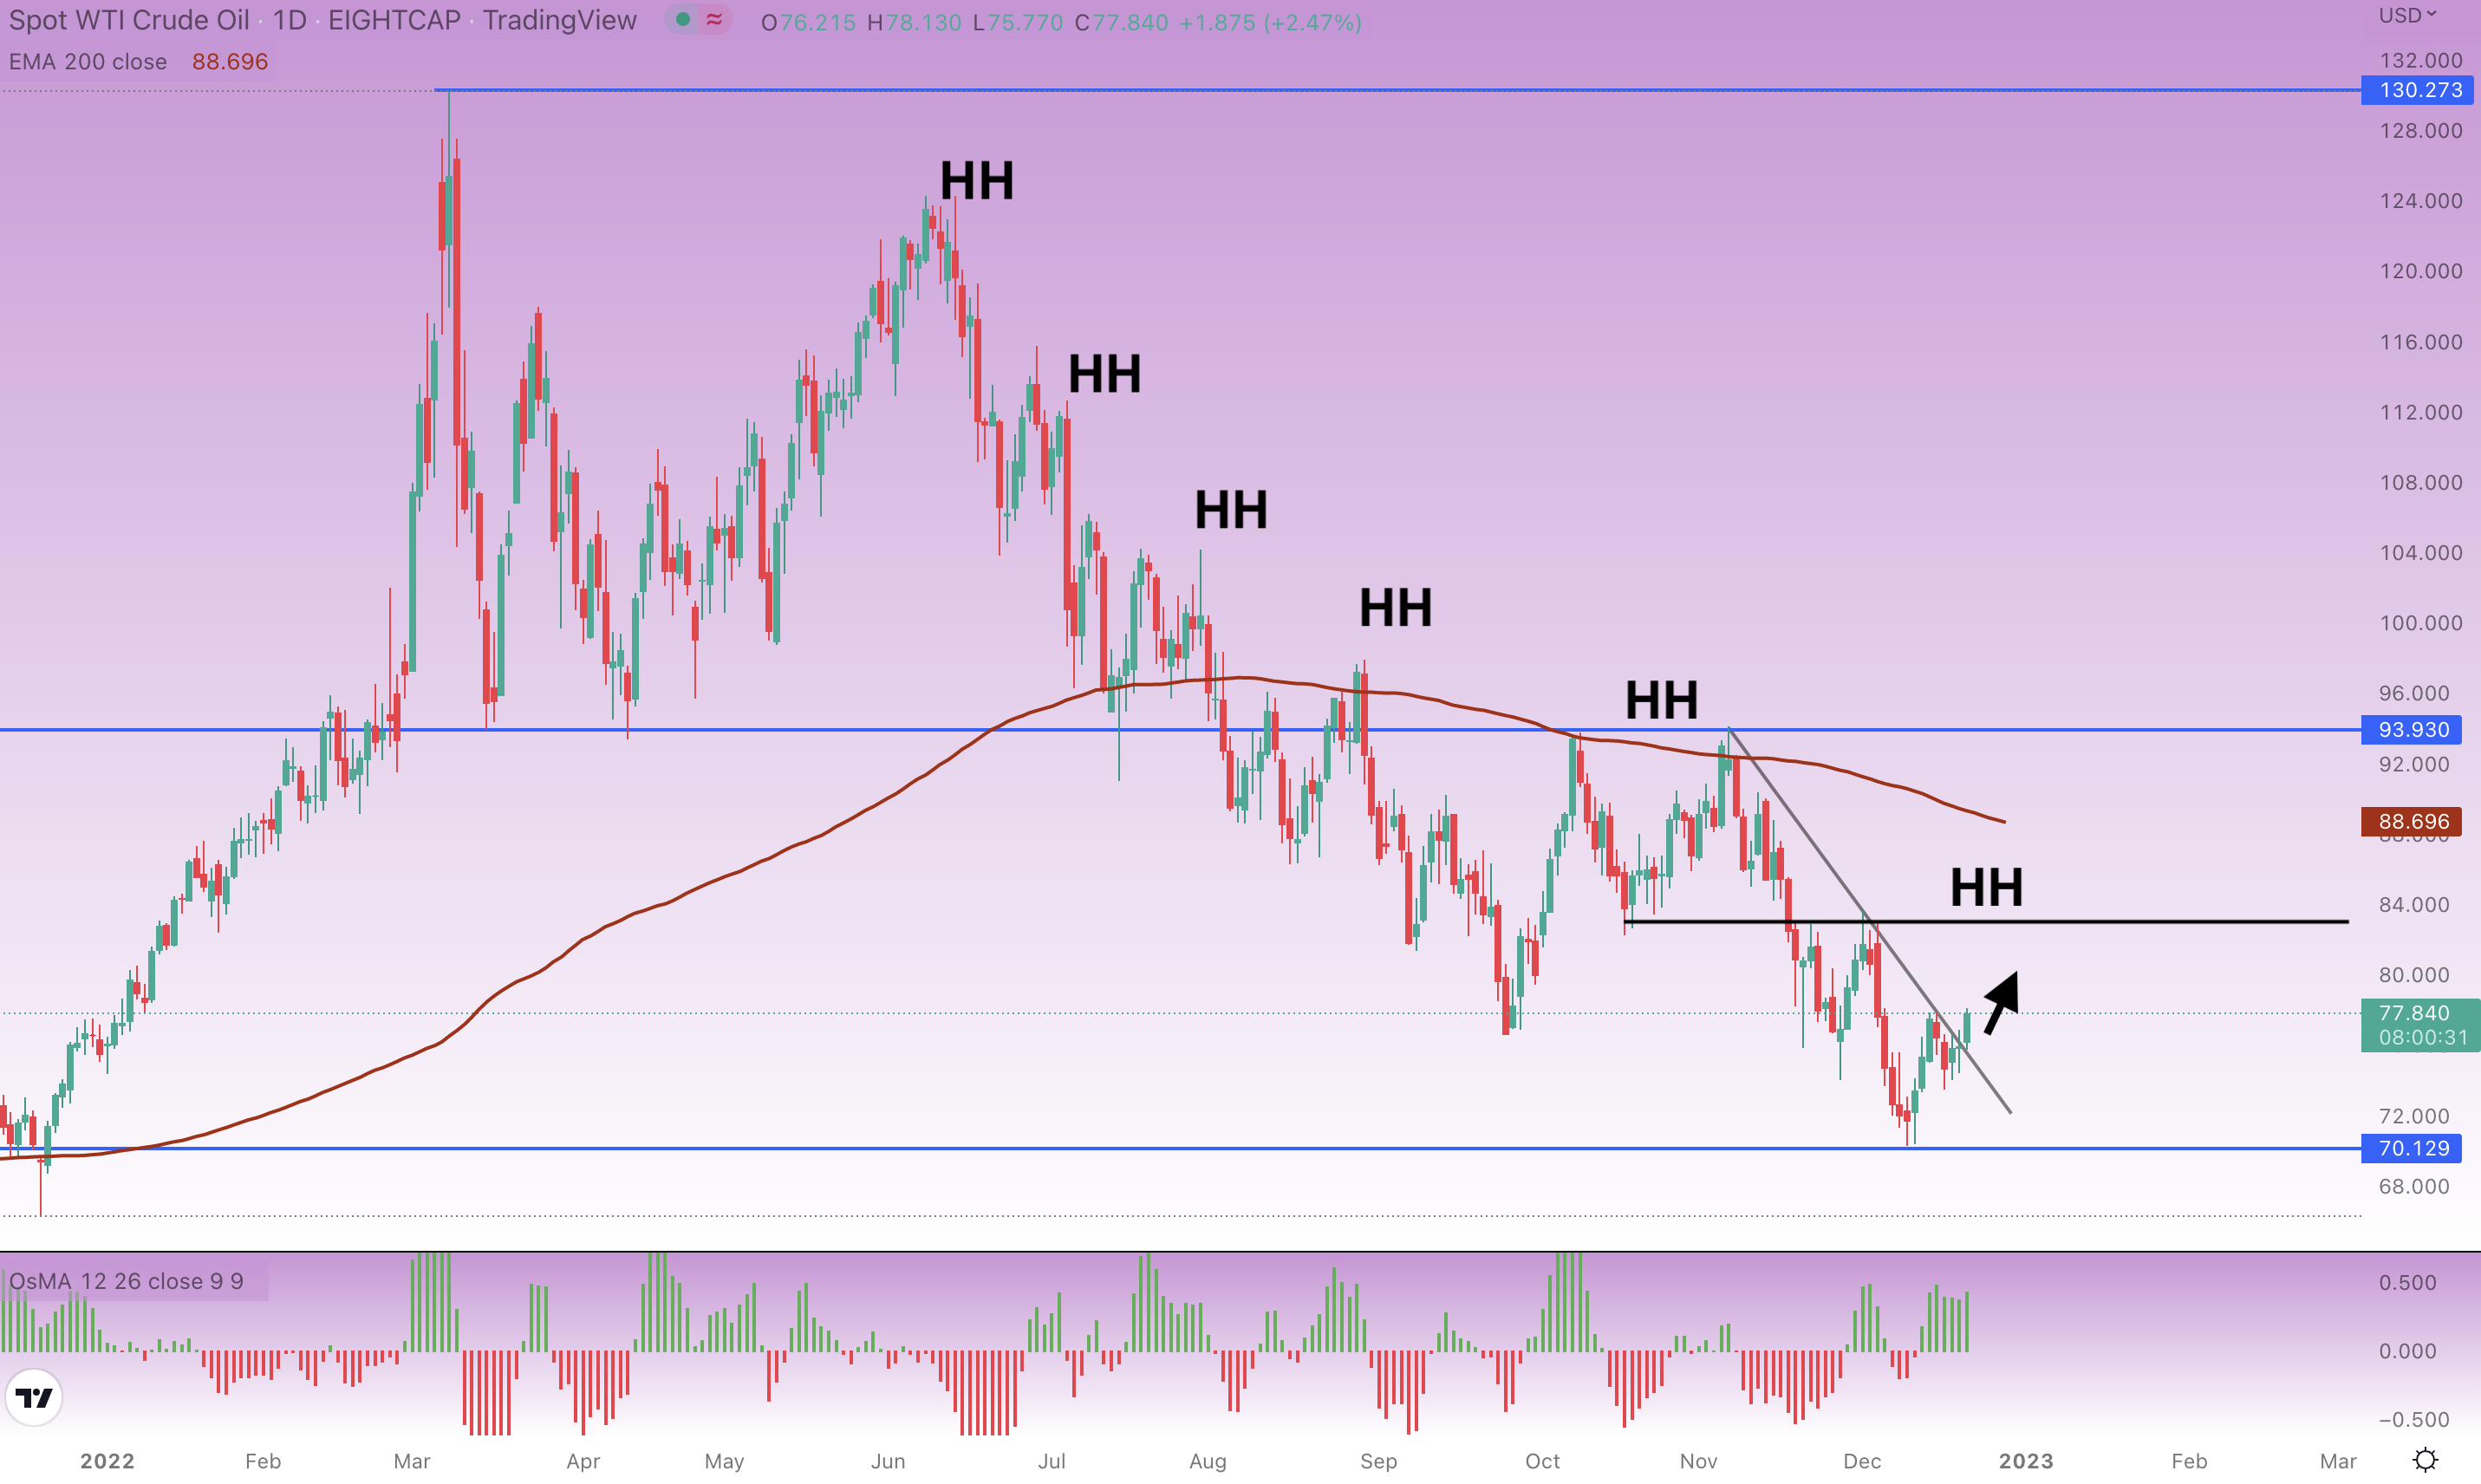
WTI Crude oil daily chart, author’s analysis, source: tradingview.com
To trade this, it is crucial to enter at the breakout of the triangle pattern. However, it is even more important to use the right stoploss as it can unexpectedly fall by 100 or 200 pips out of nowhere. So, stoploss below the price of $76 could be sufficient.
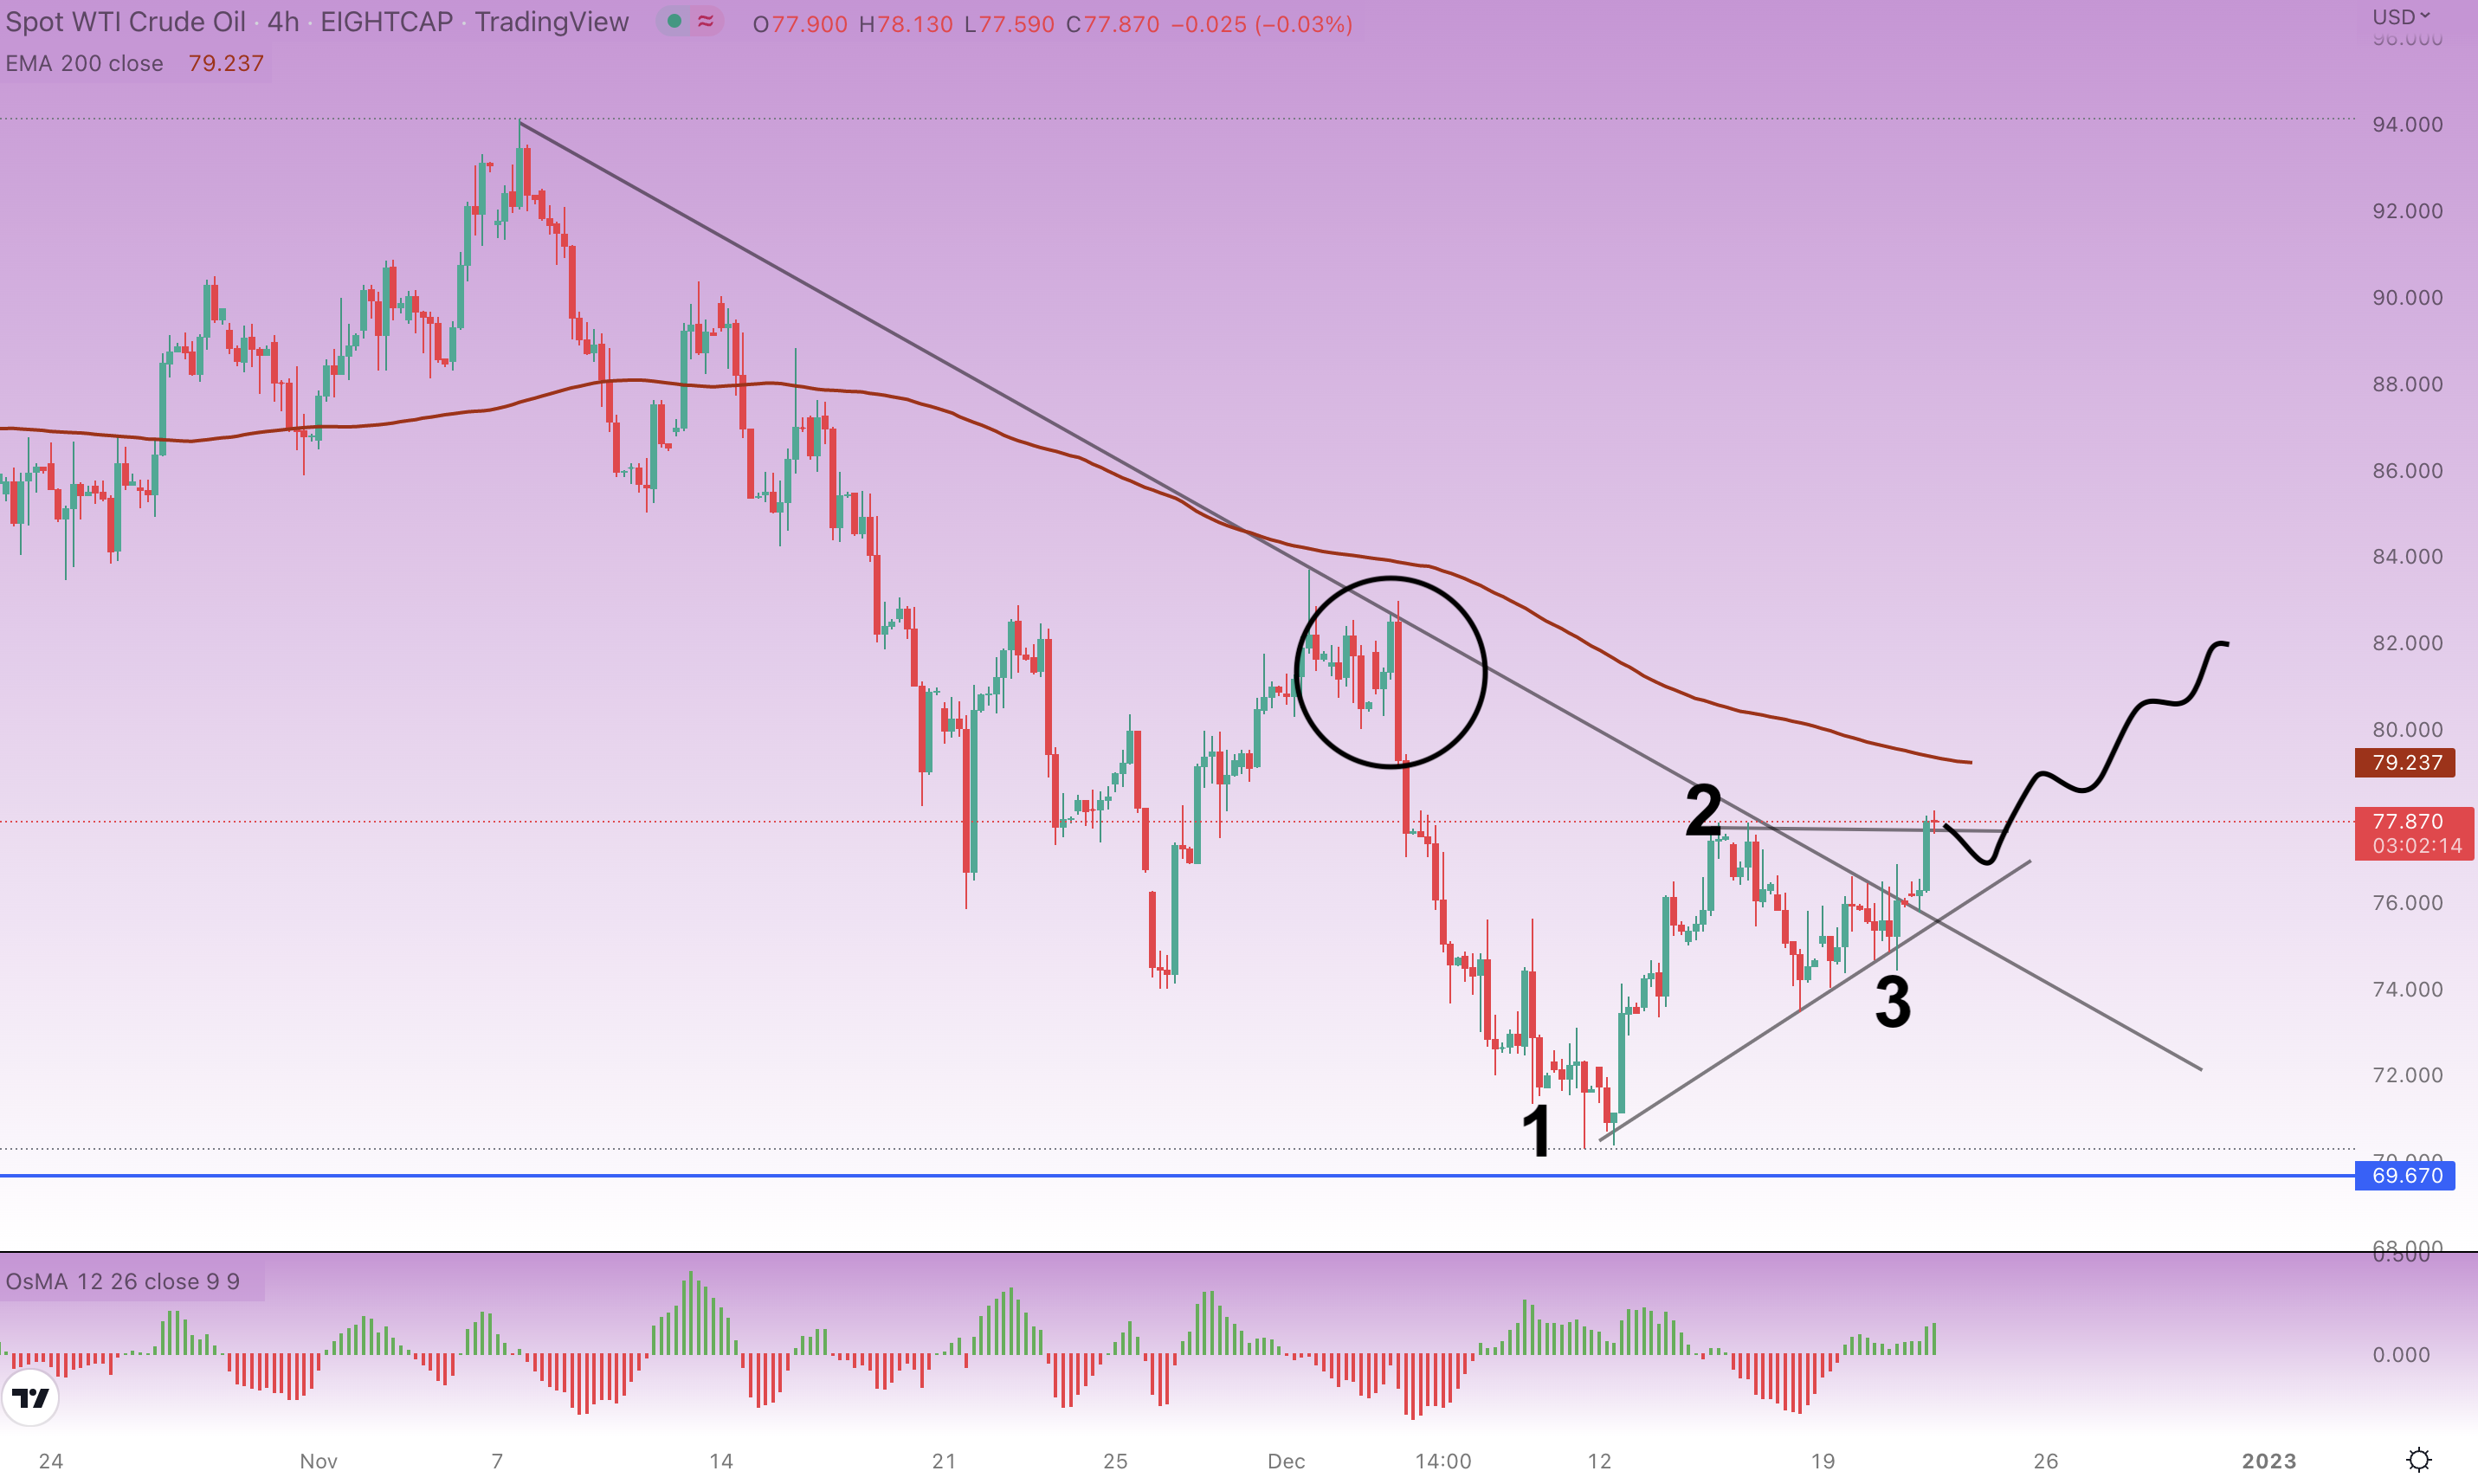
WTI Crude oil H4 chart, author’s analysis, source: tradingview.com
Final thoughts
But what about the profit target? Oil is slowly but surely on the way to filling the gap around the price of $82 (the black circle in the chart), which could be the first profit target. The riskier one would be at resistance at around $84 or higher.
Also read: EUR/JPY fights for 200-day moving average
There should be no surprising news in the next few weeks, so the oil has enough time to gradually ascend by a few percent. However, it is important to remember this is a contrarian trade and oil has been in a downtrend for several months.
This downtrend is likely to continue due to worsening economic activities. Nevertheless, the bullish signal is clear for the short term. If it turns out to be wrong, there will be many other opportunities to trade.


Comments
Post has no comment yet.