Even if the recession has already started, it’s never too late to cut your losses and look for more promising sectors that can protect your portfolio and even make you some money during the crisis. We want to let you know how to prepare your portfolio before the recession really occurs. Let’s first talk about what the crisis is.
How to define a recession?
A large, pervasive, and protracted decline in economic activity is referred to as a recession. Although more complicated calculations are often utilized, a general rule of thumb is that two consecutive quarters of negative gross domestic product (GDP) growth indicate a recession.
Read also: These three stocks ignored the recession and continued to rise
The National Bureau of Economic Research (NBER) employs a much more comprehensive approach to measuring recessions than the more straightforward (although less reliable) two quarters of negative GDP measure by taking into account nonfarm payrolls, industrial production, and retail sales, among other indicators.
In our opinion, the NBER approach is more promising. That´s because one of the economic world’s most lagging indicators is GDP, which is highly disadvantageous. We prefer to focus on leading indicators, which are also highly accurate but can give you a kickstart before a recession actually happens.
The problem is that they aren’t always 100% reliable, which can occasionally mislead the investors. However, it’s crucial to consider the bigger picture and not just make conclusion for one or a few leading indicators. According to our assessment, the most trustworthy indicators that tend to signal a recession are:
- Inversion of the yield curve (bonds)
- Stock market performance
- ISM PMI New Orders, or just Manufacturing/Service PMI, Leading Economic Index by the Conference Board, Total Inventories levels, the unemployment, and many others, which need to be compromised in a context.
You can see a fantastic leading indicator of almost any historical recession on the following chart. It is the spread between the yields on 10-year and 2-year bonds. Briefly, when the yield curve inverts or moves into negative territory (for a variety of reasons), recession almost always follows. Recession is represented by shadow lines.
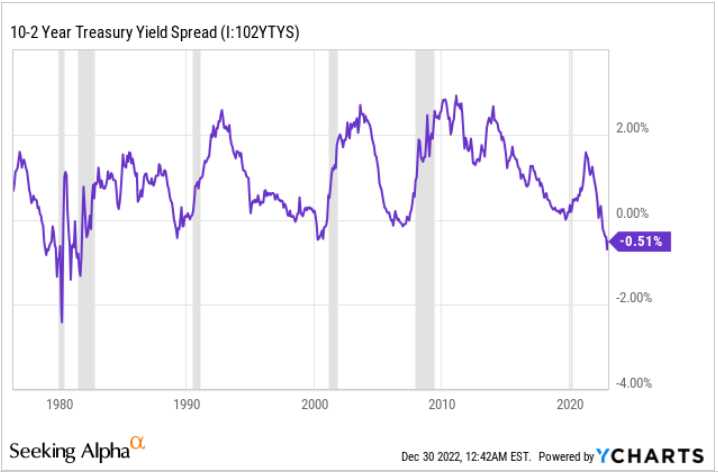
The spread between 10Y – 2Y in bond yield, source: Seeking Alpha via YCHARTS, author’s analysis
Sector performance during the various business cycle phases
The following table from Fidelity reveals which sectors tend to outperform during the various economic cycles. In the very early stages of the economic cycle, or, let´s say, after the end of a recession, financials, real estate, and industrials tend to outperform the market massively.
May be for your: Three safe stocks that grow their dividends in recession
On the other hand, these are the sectors that tend to significantly underperform during a recession or crisis. The best-performing sectors in such an economic cycle are consumer staples, health care, and utilities. Why? Let´s look more deeply.
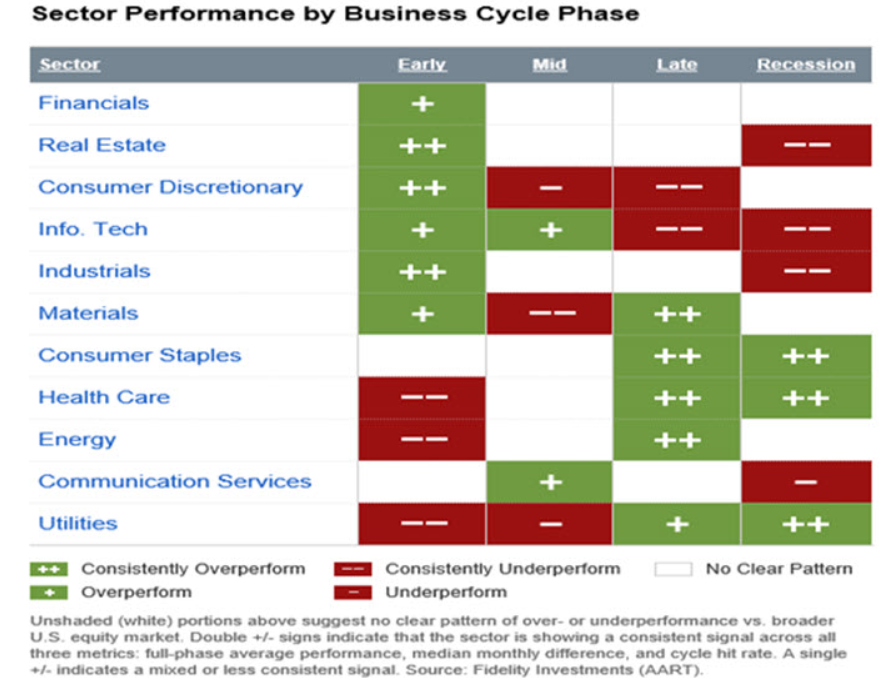
Sector performance by business cycle phase, source: Fidelity
The table above is not only a theoretical one, but it is based on real outcomes. However, everything always depends on the stability of EPS, net sales, and the outlook. Even companies in “underperforming” sectors during the recession, let´s say the technology sector, can rise if the outlook has not worsened. From this point of view, the best is to use the same growth criteria and filter stocks. We will cover it (such criterias) in a different article.
Why are these industries performing so well?
First of all, we need to conclude that every recession is different. While the dot-com bubble had been associated mainly with the tech bubble, in the great financial crisis of 2008 there were major issues with banks, mortgages, and real estate, and in 2020 we saw massive supply-side shocks.
Read more: The 8th Wonder of the World – what is compounding effect?
From this perspective, it is critical to remember that we do not always see the same or similar sector performance based on theory. Let´s look now at different periods and how each sector performed.
Dot-com bubble and sectors performance
As we can see in the chart, the performance of the given sectors really depends on the selected time period. Looking at the data from 1999 to the end of 2002, we can conclude that the technology sector was in the pure bubble, which busted with a greater drawdown than 70%.
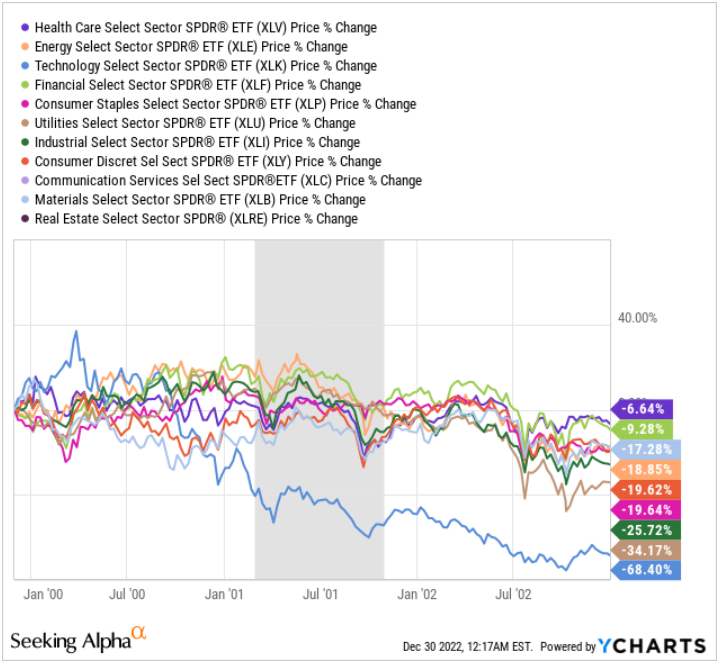
Sector performance during Dot-com bubble, source: Seeking Alpha and YCHARTS, author’s analysis
On the other hand, the healthcare sector ended the period with a -6.6% loss, while the drawdown had been slightly lower. The financial sector did quite well too.
Great Financial Crisis and sector performance
The GFC that began in 2008 was significantly different from the one that began in 2000/2001. It was associated with an unhealthy mortgage and housing market, which led to an overall bubble and ended with the crashes of financial companies such as banks and insurance companies, with real estate prices dripped like a stone.
The selected dates start with January 1st 2007 on purpose to see how the sectors acted just before and right after the crash. While the energy crisis had been very strong in 2007, it significantly crashed in 2008 and lost more than 50% of its value.
On the other hand, the biggest drop could be monitored in the financial sector. Despite a drop in overall demand, consumer staples and health care remained very strong as stated in the previous table from Fidelity. Such sectors also faced solid drops in 2008, but compared to the S&P or other sectors, they did very well. Now let´s dive into why such sectors are doing quite well.
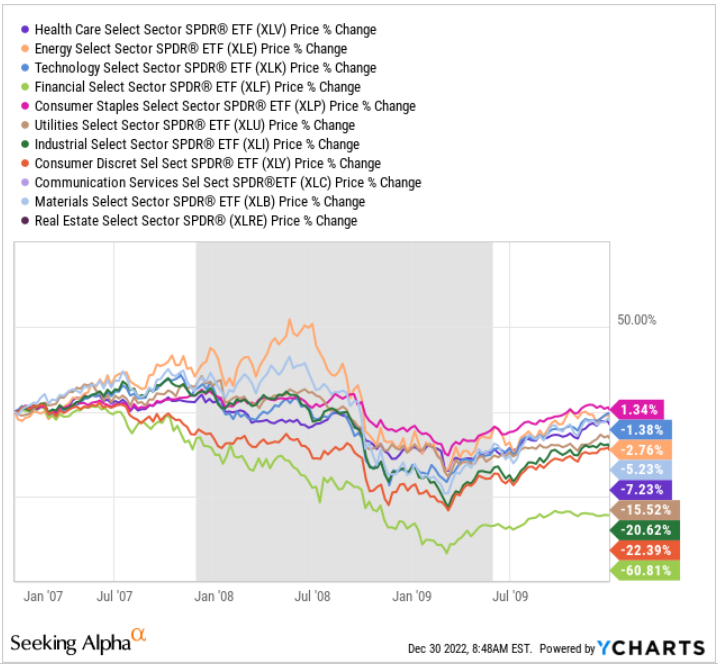
Sector performance during GFC in 2008-2009, source: Seeking Alpha and YCHARTS, author’s analysis
2022 sector performance
While it is unclear whether or not we will experience a recession in 2023, our team believes there is a high probability that we will if the Fed does not change its course. However, when the monetary tightening started, we saw a massive valuation reclassification due to the surge in real yields and nominal yields as well. The leading indicators seem pretty bad.
Explore: How to become a better investor in 2023
The energy sector will account for the majority of the gains in 2022. It is due to high oil and gas prices; however, oil has suffered a significant setback as global demand has decreased. In our view, the XLE as an energy sector could follow, despite its very fair valuation.
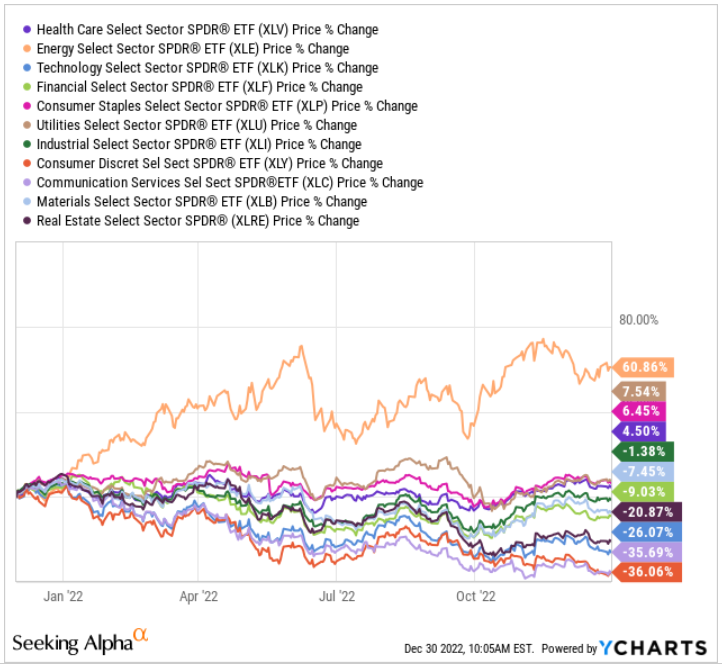
Sector performance during GFC in 2008-2009, source: Seeking Alpha and YCHARTS
The biggest losses can be spotted in consumer discretionary, technology, and real estate. On the contrary, utilities, healthcare, and consumer staples are among the gainers.
In our view, this is much more similar to the dot-com bubble, until something bigger breaks in the economy. The current sector performance can significantly vary in the next 3-6 months, but defensive sectors are usually considered great plays when one is hedging against recession.


Comments
Post has no comment yet.