The current macro report is being written during the Friday session, a little less traditionally. The weekly candles are not closed, but this week we got stunning CPI results, which we will go through. The market reacted violently.
The latest asset movements
However, because this text is being written on Friday, we do not completely extinguish the candles, as previously stated. However, the market reacted very positively to better-than-expected CPI results, so we can see how asset prices or structures changed this week in the table below. Risk assets, followed by the Nasdaq, rose dramatically, in contrast to US yields, which declined very solidly as a reaction to better inflation printing.
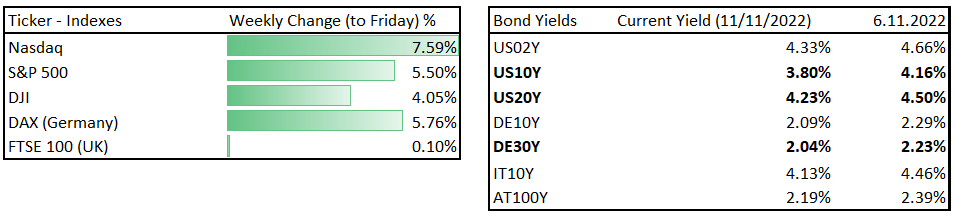
Asset movements, Source: Investro analytics team
Inflation breakdown
According to our previous article here:
“Inflation in the US, as determined by the Consumer Price Index (CPI), decreased to 7.7% on an annual basis in October. The CPI and the Core CPI were 0.4% and 0.3%, respectively, for the month, falling short of forecasts made by experts in both cases.”
The absolute key point here was the significant improvement in MoM, as we have been forecasting for a while. This is the result from the chart:
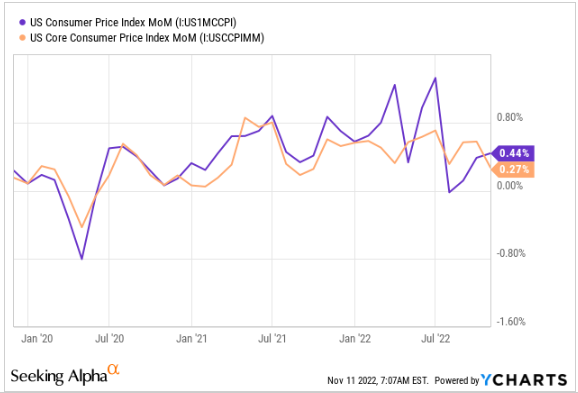
US CPI and Core CPI MoM, Source: Ycharts via SeekingAlpha
As we can monitor, there is a slight slowdown; currently, it’s too early to talk about the negative trend. One thing is obvious and that is peak inflation measured by YoY basic. This number has been really good. If we see similar figures in the coming months, we may be talking about the effects of Fed policy easing.
Honestly, we have been talking about easing inflation in our previous macro reports, as we saw drastic improvements in many leading indicators. The base case remains that the Fed will bring inflation under control and ease sooner than expected. As we still believe the Fed will continue to tighten, they will probably be more cautious. In the last macro report, we summarized that the FOMC wants rates “higher for longer,” but if inflation slow downs faster than they anticipate, our belief is that it will be sooner.
You may also like: Another domino has fallen – the FTX saga has a new victim
In the case of leading indicators, there are many great ways to look at them. See the following chart below; such indicators are highly correlated to CPI, but CPI used to lag a bit. M2 YoY is down, ISM Price Paid is down, and commodities such as oil and industrial commodities are also slightly down. There is great room for further deceleration in trend, and thus MoM results can slow down.
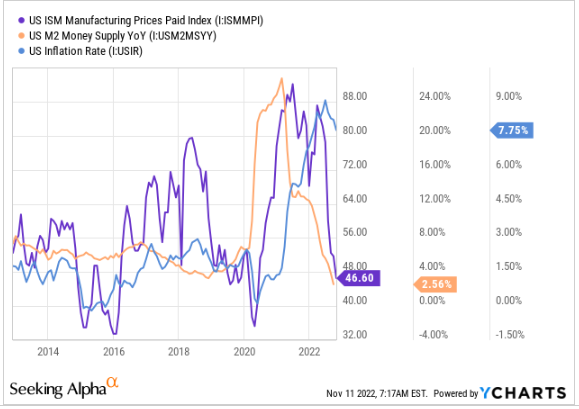
Leading indicators (CPI), Source: Ycharts via SeekingAlpha
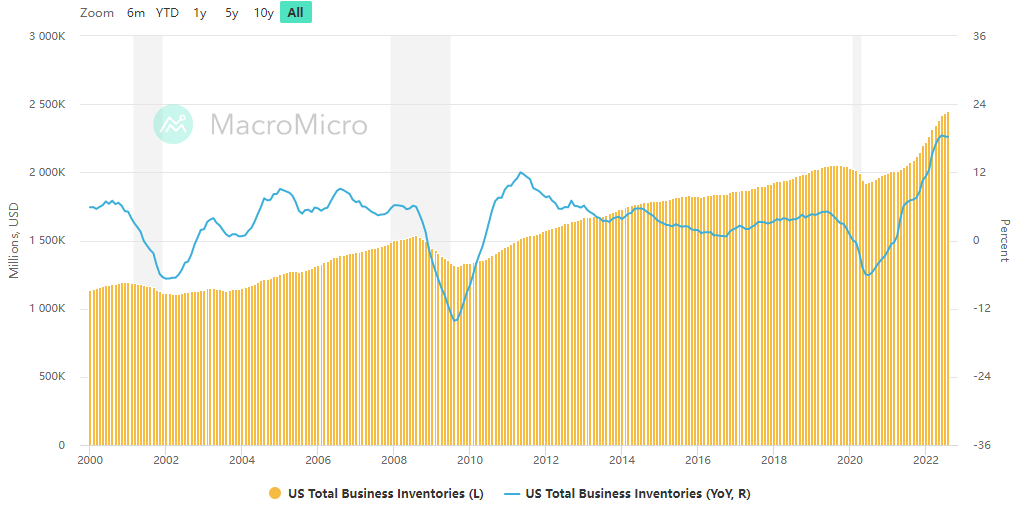
Also, companies have many inventories on their asset side of the balance sheet, which can result in further discounts. However, they are at an all-time high in absolute terms, but relative to the sales ratio, they are becoming slowly higher. Could it result in further discounts in the 4Q? Probably. However, they are far enough from the peak in 2008 or from similar levels in 2015 and 2019–2020.
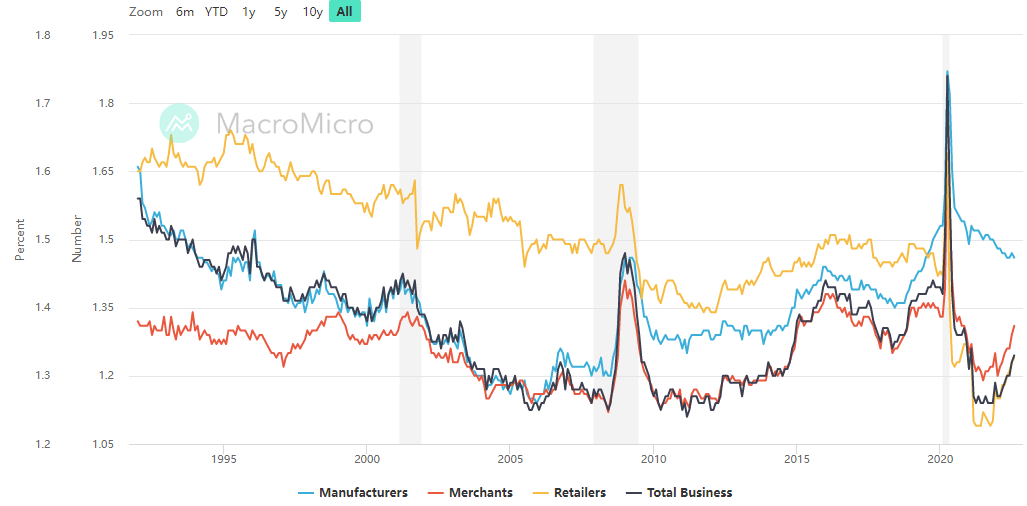
US Inventory-to-Sales Ratio, Source: MacroMicro.me
However, looking at the chart below, inventories are at an all-time high and also very high measured by annual change (YoY). If the buying appetite in Q4 (the Christmas season) is worse than expected, retail sales could plunge, which would strengthen deflationary pressures. Because retailers would be forced to sell things cheaper to gain some cash flow.
What to expect now?
These indicators are telling us that the inflation trend could be slowing in the months ahead. On the other hand, without an increase in unemployment, it will not be so easy, because there have been and will continue to be wage pressures from employees to combat inflation and increase their wages. However, as many companies face slowing demand, they have begun massive layoffs, primarily at blue-chip firms (source here):
- Twitter: 50%
- Cameo: 25%
- Robinhood: 23%
- Intel: 20%
- Snapchat: 20%
- Coinbase: 18%
- Opendoor: 18%
- Stripe: 14%
- Lyft: 13%
- Shopify: 10%
- Meta: “Thousands”
- Apple: Hiring Freeze
- Amazon: Hiring Freeze
Wage pressures will be a strong contrarian factor that will fight with CPI deceleration. However, with the combination of macrofactors – monetary policy, commodity markets, and slowing demand – there is a great probability that the Fed will succeed in its mission to bring inflation back down to 2%.
Read also: S&P 500 skyrockets after US inflation moderates
However, we are only halfway there, and it is very premature to say if the Fed is winning this fight. There are great signs that inflation will slow down. However, they are likely to remain extremely hawkish. The problem is that the market reaction priced in a quick pivot (look at the spread between rates 2023 and 2022). From this point of view, we have been bullish on bonds for weeks, but in the case of stocks, it’s more about stock-picking now. We discussed FFF (Fed Funds Futures) spread reduction in the last two reports:
“According to FFF, rate cuts are currently not priced in the bond and stock markets. We believe that this spread will narrow, which could lead to a solid bullish or bond market rally. This trend will depend on inflation data, but looking forward, we are convinced that we will see the spread narrowing and that is not currently priced in. In other words, there is still room for a bullish rally, looking forward 1-3 months.”
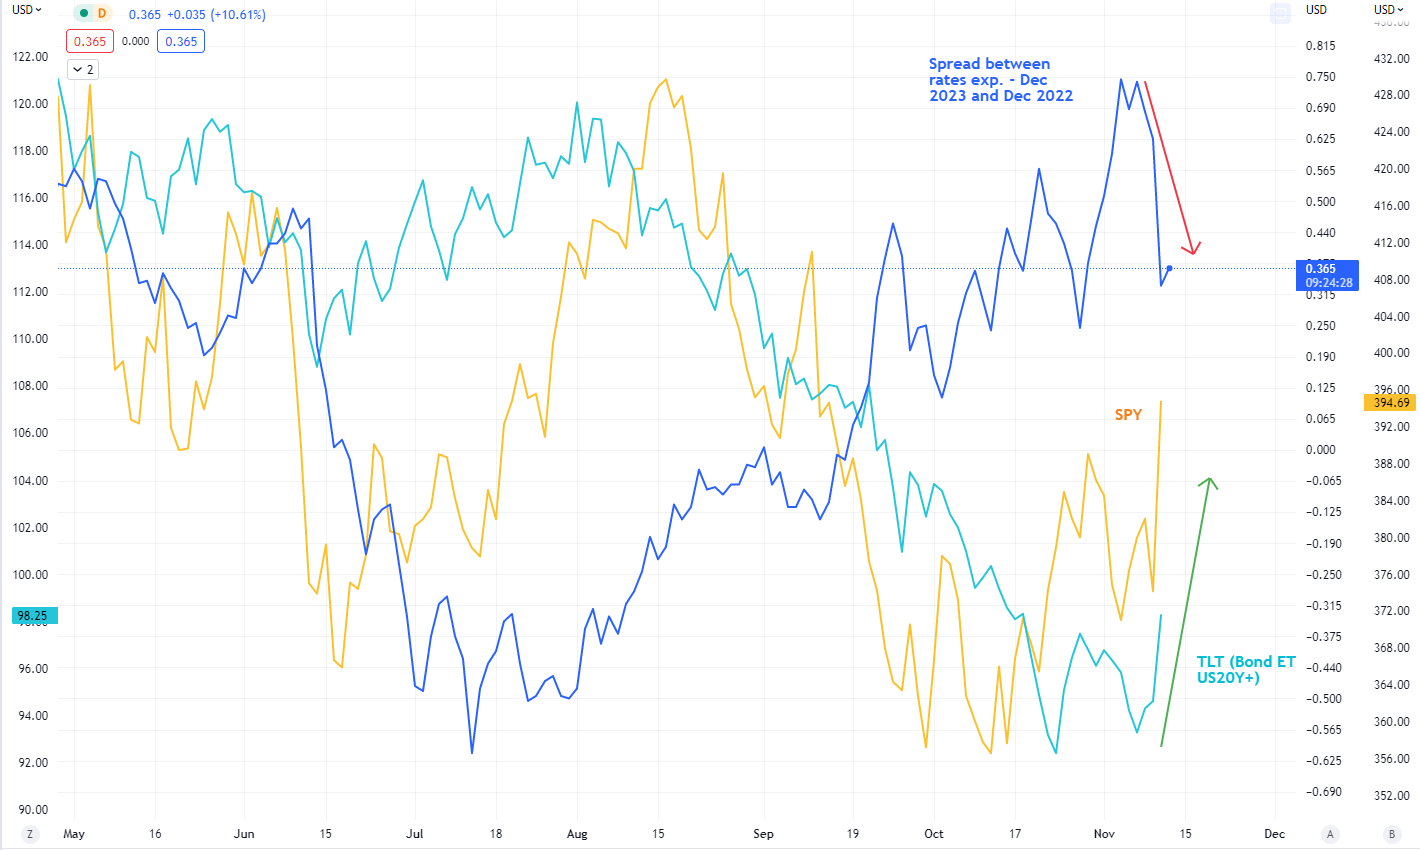
To summarize it, in the case of bonds, we are more bullish than in the stock market. There are plenty of reasons, but the main ones were described in the previous macro reports.
Warning: The fully covered text is not investment or trading advice. It represents only the author’s point of view and thoughts, and we do not bear responsibility for your potential loss. The article serves only for analytical and marketing purposes.


Comments
Post has no comment yet.