Since September 2009, there was a key point among investors—TINA, which represented There Is No Alternative, except for stocks. In the case of the current nice and high yields in the bond market, we see there is finally an opportunity.
The latest asset movements
In the latest week, there was a release of CPI data from September. However, the inflation print turned a bit more negative than consensus, and the market moved rapidly due to ECB announcements. However, Friday’s session almost completely removed Thursday’s move up.
Read our special and fresh analysis on the latest inflation print: Inflation breakdown-Not as bad as it seems
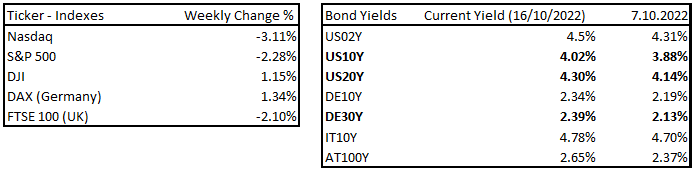
Latest asset movements, Source: Investro analytics team
Worst run in the 60/40 portfolio
Honestly, it’s already been a few weeks since we said we consider bonds very attractive in the long term. It’s because yields, both on the front-end, but also at the back-end, dramatically rose, and thus long-term investors have an advantage in fixing the yield on the US10Y at 4.0% p.a. or 4.3% on the US20Y right now.
Assuming that the long-term stock average is calculated near the 10%-11% p.a. (depends on asset class), it is quite a solid way to diversify the portfolio. The issue is that a very traditional portfolio allocation with 40% bonds (US30Y) and 60% stocks (S&P 500) performed very poorly this year. We cannot wonder that the bubble in the bond market busted, as in the EA, but also in the USA, the rates sat down too low for a way too long.
You may also like: Inflation – what it is and why should everyone pay attention
In the next chart, we can see the historical performance of such a type of portfolio, and now it tracks the worst performance ever, or just in 100 years! This is a great entry point for long-term investors. However, the market can still go even lower and the loss can be much bigger. The long-term average of such portfolio construction is near 9% p.a. Such a portfolio doesn’t tend to correlate positively as strongly as it did this year. However, we can see a similar move in the 30ies and 70ies, both in times of strong inflation pressures and with strong hawks on the monetary policy side.
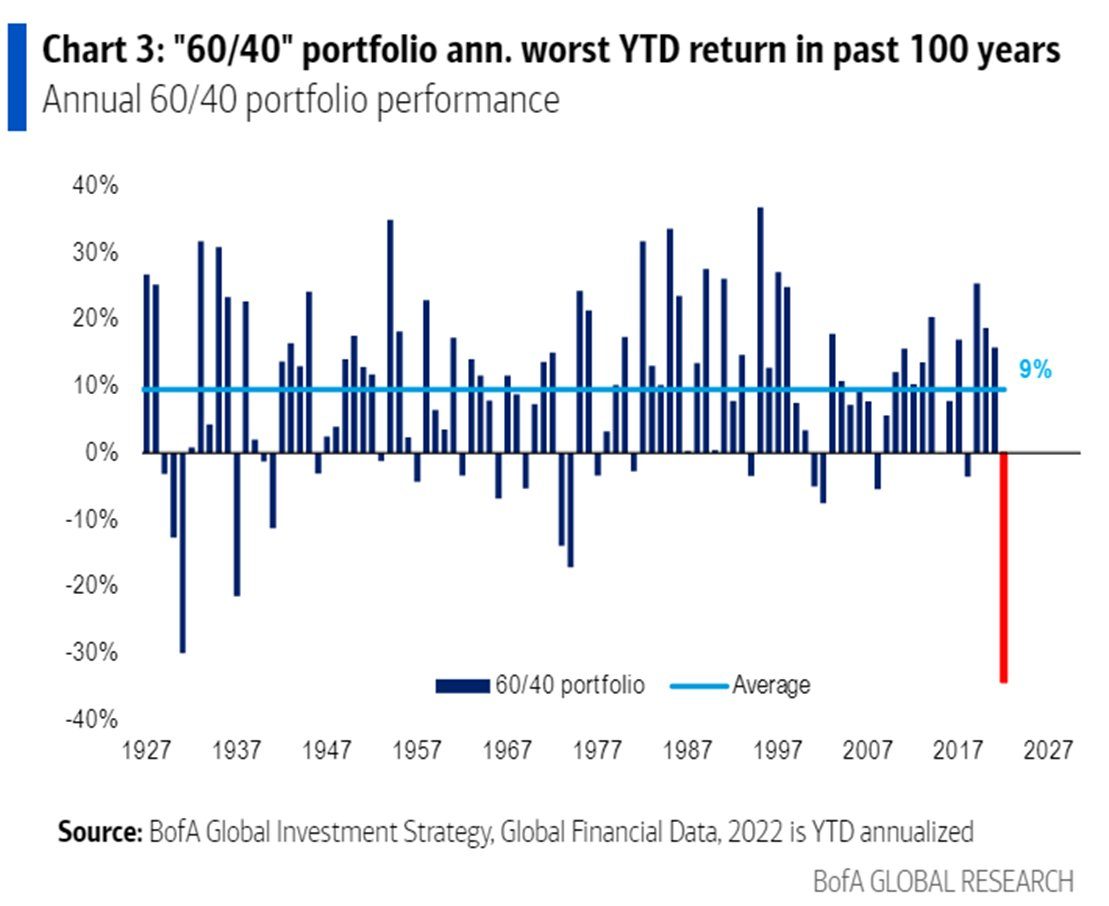
Annual 60/40 portfolio worst return in past 100 years, Source: BofA GLOBAL RESEARCH
It’s very funny, because in current monetary circumstances, we are in the most aggressive hiking cycle ever (check chart). Definitely, the inflation rate is not funny; the funny thing is what the FOMC members are saying:
FED’S BULLARD: “I’M HAPPY FED 75 BPS RATE HIKES HAVE NOT CAUSED MARKET TURMOIL”.
And what is market turmoil, when the most traditional portfolio allocation “dips” more than 30% in a year? Check out the chart below for a visual representation of the Fed’s hiking cycles. However, stocks are doing quite well when long-term bonds are losing very rapidly due to the strong effect of duration.
Currently, we have seen some EPS revisions downwards for 2022 and 2023, but not as big as history suggests. Actually, the current stock move downwards is mainly impacted by the rise of the real yield curve (as well as the nominal yield curve), which tends to normalize the ratios P/E, P/B, and other multiples. The reason stocks decline is because investors discount their future cash flow and thus there is a “repricing process”.
In the most valuable valuation methods, such as DCF, the valuators/investors/funds tend to discount the future cash flows (forward-looking ones), where into the calculation comes US yields or other yields or cost of debt and equity. As yields rise, the discounted future cash flow declines and vice versa, valuation of such companies is going down (impacted by lowered CF in the future) and that is the reason why we see the downturn, mainly in tech stocks.
Read also: Positive news for the food market from India
As we said, EPS revisions just started to be lower for 2022 and 2023, but are still high due to the aspect of nominal EPS, which is impacted by inflation. In summary, this drop in stock is mainly impacted by the rise in nominal and real yields, in our opinion by 70-75% (subjectively) and 30–25% by EPS revision. Keep in mind that such a revision trend can go much lower if the macro environment continues to deteriorate.
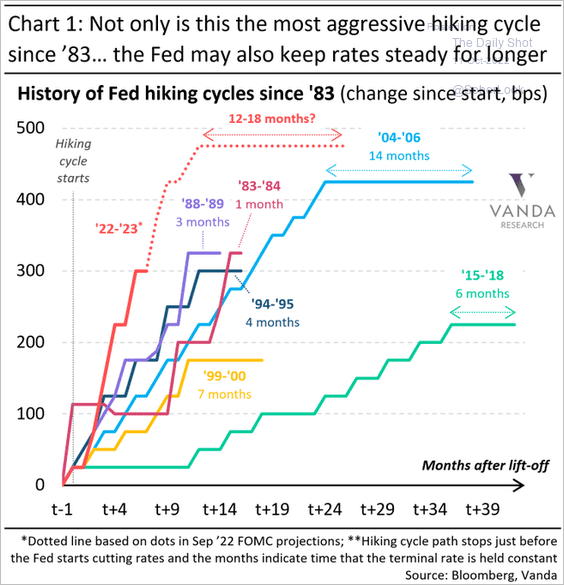
Historical hiking cycles, Source: Vanda Research via Bloomberg
Bond market = favourable risk/reward ratio
Why do we say that? Because a great chart from JP Morgan demonstrates the impact of duration in current conditions. For example, the JPM Asset MNG reveals that the impact of a 1% rise or fall in interest rates (understand the shift among whole yield curve) will lead to a more favourable outcome on the long side than on the short one. Assuming the most dangerous, US30Y bonds (price) should decline by 12.2% if we see a further spike in yields. However, if we see a decline, the price of such a bond could rise by 24%. It depends on each category’s duration.
There is still a risk of another spike, owing to the current lack of liquidity in the bond market; however, this could be easily solved if you choose a bond with a short duration, such as US05Y or corporate bonds with short maturities, where the risk-reward ratio is absolutely the most appealing. In the case of HY bonds, we would not be so sure. Keep in mind that this is just a theoretical calculation and real numbers could differ significantly, but it has the right point right now.
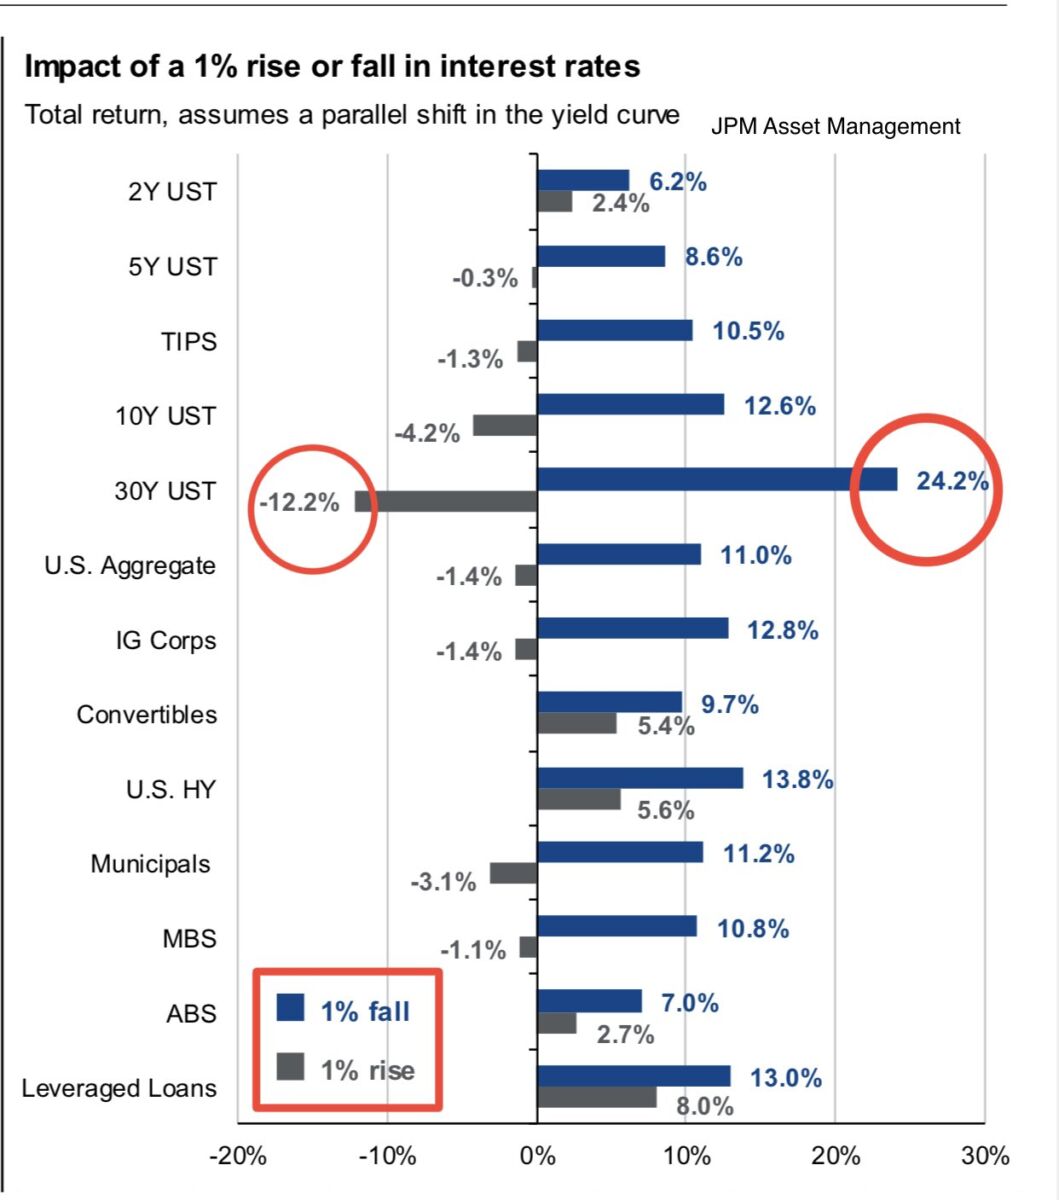
Impact of a 1% rise or fall in interest rates, Source: JPM Asset Management
In the previous macro report aimed at inflation-linked bonds, we revealed it as a very solid strategy for the end of 2022 and 2023. However, as we can see on the previous table from JPM, it still has some duration risk, but such a bond pays a coupon impacted by inflation. However, there are distributing funds/assets, such as tickers: TIP, SCHP, or LTPZ.
Their price and coupon depend on the duration, where it needs to be remembered that the higher the duration, the higher the risk and gain caused by interest rate rises and declines. In Europe, there is also a great ticker, IDTP, which is similar to US TIP, but reinvested coupon is included in the price automatically.
Warning: The fully covered text is not investment or trading advice. It represents only the author’s point of view and thoughts, and we do not bear responsibility for your potential loss. The article serves only for analytical and marketing purposes.


Comments
Post has no comment yet.