During the latest two weeks, many things happened, and many great macro indicators came back to light. And also, asset classes have developed nicely. Let’s summarize it and then go in-depth to draw some conclusions. The article’s title is self-explanatory: “recession or not?”
Latest asset movements
First of all, let’s summarize how the markets have developed since we took a little break in mid-November. While there has been a continuing uptrend in stocks, the largest moves have not been matched by this asset class. The massive repurchasing was seen primarily in bonds with long maturities, such as 20-year+ US government bonds (US20Y) or 30-year+ German bunds (DE30Y). Why?
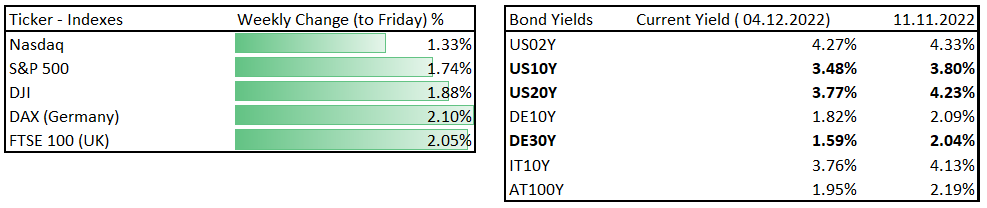
Asset movements, Source: Investro analytics team
Long-term yields dropped significantly, so bond prices improved solidly. This is also indicated by ETF bond holdings such as TLT (iShares 20+ year Treasury Bond ETF), which most likely found the bottom in October. We have been bullish on long-term bonds for several weeks, most recently for 2-3 months, and have stated numerous times that it could represent a great opportunity in the medium term.
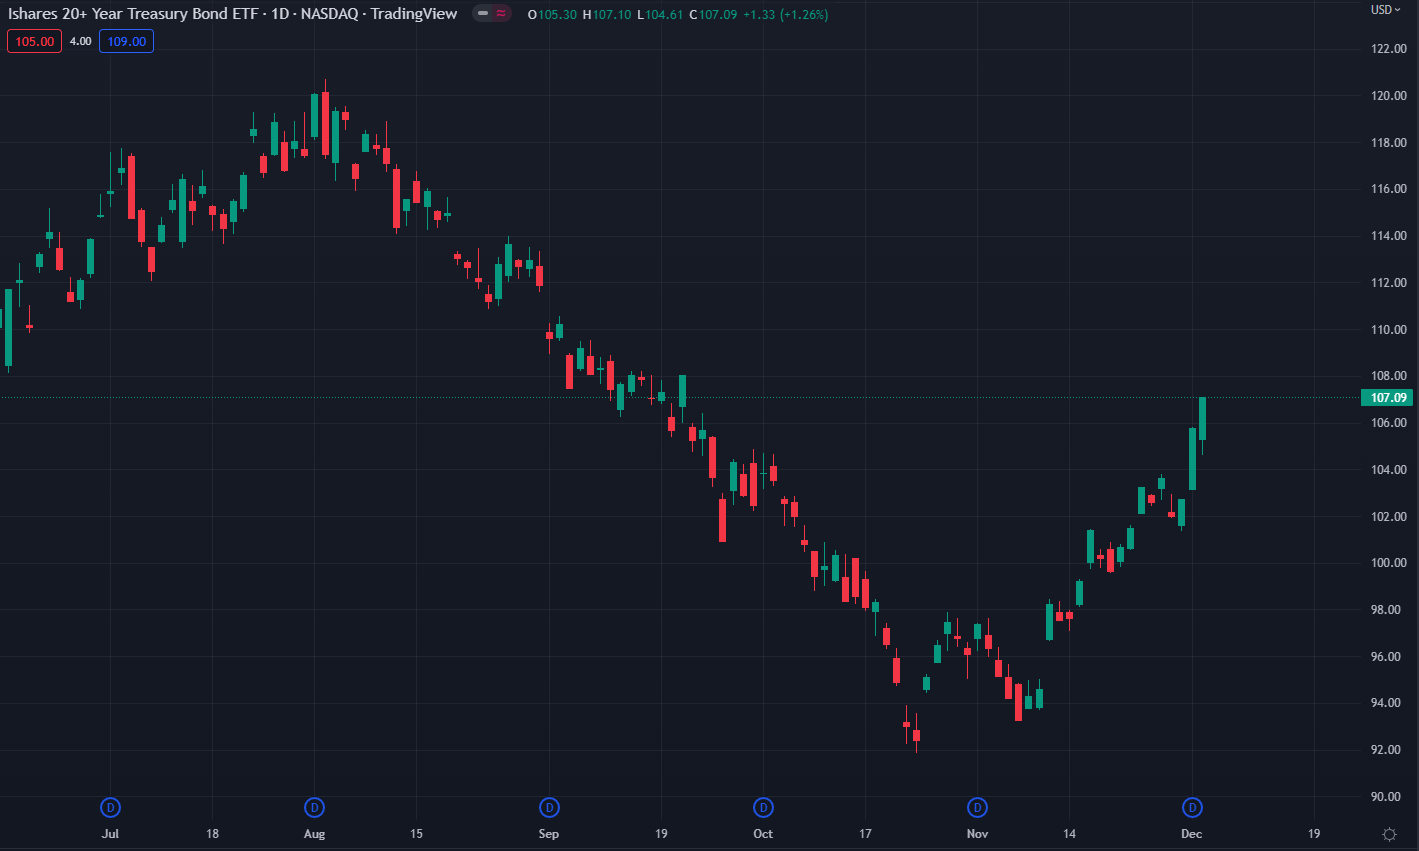
TLT, Source: Tradingview
While the Fed can almost perfectly control the short-term yield curve (0–3 years), the long-term yields such as 10 years and more are mainly reflections of future growth and inflation expectations.
Inversion of the yield curve
When the yield curve is inverted, short-term interest rates are higher than long-term ones. An inverted yield curve (also known as a negative yield curve) is a common precursor to a recession.
You may also read: No proper sales in the markets on Black Friday
As we see in the table above, short-term yields are higher than long-term ones. When short-term interest rates rise above long-term ones, this is known as a “flattening yield curve,” and it indicates that investors are shifting their money from short-term bonds to long-term bonds. As a result, the general consensus among investors appears to be growing gloomier about the economy’s near-term outlook.
The spread between US10Y and US01Y shows that the US01Y (short-term) yield is 1.2% higher than the US 10 year yield, implying that the market is signaling not everything in the economy is fine. As shown in the chart below, every time since 1971, when the inversion became negative and the PMI (Purchasing Managers´ Index, a leading indicator for an economy), was slowing, we faced a recession.
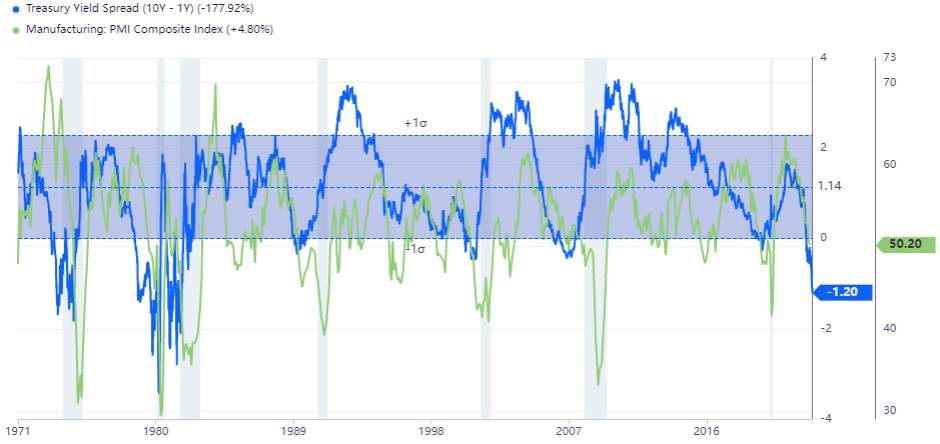
Treasury Yield Spread and Manufacturing PMI, Source: Investro analytics team, data by gurufocus.com
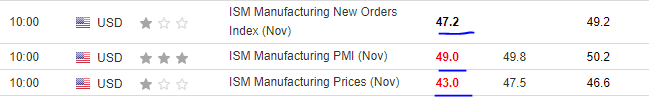
However, the recession occurs when the Fed starts to cut rates and the yield curve becomes positive or fully reserved. It’s because short-term yields will fall much faster than long-term yields (though both will fall). By the way, the most recent PMI data from November indicates that the indicator fell again, this time to 49 just a few days ago.
Our favourite FFR and the latest fundamentals
It is critical to understand where the market is currently pricing in the future hiking cycle for great market purposes. As we see in the chart below, the market expectations via the Fed Funds Rate (futures) currently stand at 4.5 in 12/2023. When a recession occurs, interest rates are cut by 200-300-400 bps, so we are far from market pricing in a recession mode.
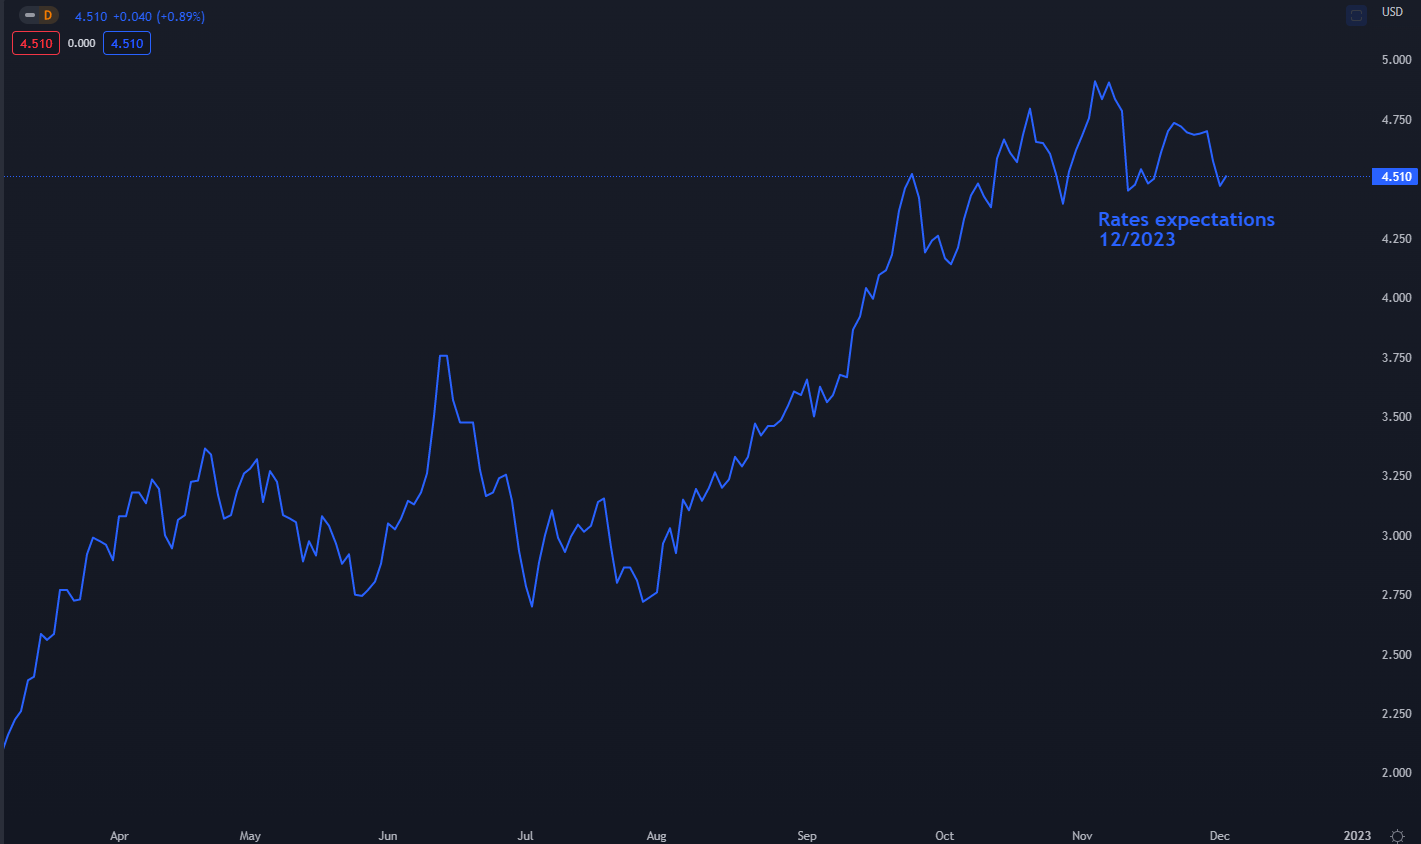
Rates expectations measured by Fed Funds Futures, Source: Investro analytics team via Tradingview
While there has been a significant drop from a peak, almost from 5%, this has been the primary determinant of stocks and short-term bonds reversing their trend. In our view, there is a much bigger probability that market rates can go down rather than up, as many leading indicators are worsening, even if inflation would be higher.
Read also: Can we afford Christmas?
While we have already mentioned that the ISM Manufacturing PMI fell to 49, which is bad news because it beat the consensus downward, there were two other very important data points from the PMI that received less attention but are still very important.
Such datasets are very important, because they’re a leading indicator for EPS (earnings per share) for many companies. Our team did some research and found out that there is a great correlation between the ISM Manufacturing PMI, as a representative of the macro cycle, and the S&P 500 EPS. The worse the PMI, the worse the EPS (YoY), and vice versa.
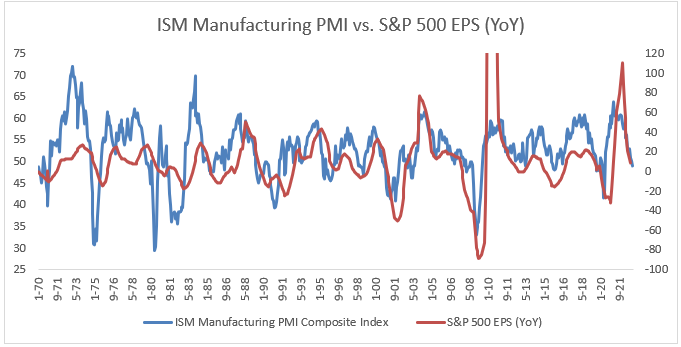
ISM Manufacturing PMI vs. S&P 500 EPS (YoY), Source: Investro analytics team
And we are talking about New Orders and Manufacturing Prices. The first mentioned is a very great predictive tool: how the orders in the economy develop. While there are still worsening numbers, the outlook is not positive.
The second one, prices, is a positive one because it reflects that input prices in the industrial and production cycles are getting lower and is a leading indicator for the development of inflation. As a result, inflation could go down faster than the market and Fed currently anticipate. The most recent data came from the labor market—nonfarm payrolls, which surprised markets by increasing by 263k (200k consensus).
For more info: US market trades lower on a payroll day
This is positive for the economy and negative for the markets, as the Fed can be more direct as the labor market is currently not under pressure. Keep in mind, however, that the labor market is one of the most lagging markets. There are signs that it will slow down.
Economic calendar, Source: Investing.com
Trade idea
While bonds did a solid job, our opinion on the markets remains intact. We are still bullish on bonds (with long duration), and slightly bearish on the stock market. Firstly, due to a still elevated long-term valuations. Secondly, due to EPS, which could almost certainly face further negative surprises as macroeconomic leading indicators deteriorate.
Bonds are more clear because the market is not pricing in a recession (we do not say we will face one, but the probabilities are increasing), and furthermore, our team believes that inflation will go down faster than the Fed and market currently expect. Whether there would be a recession or not, it could be a bullish point for bonds rather than stocks right now.
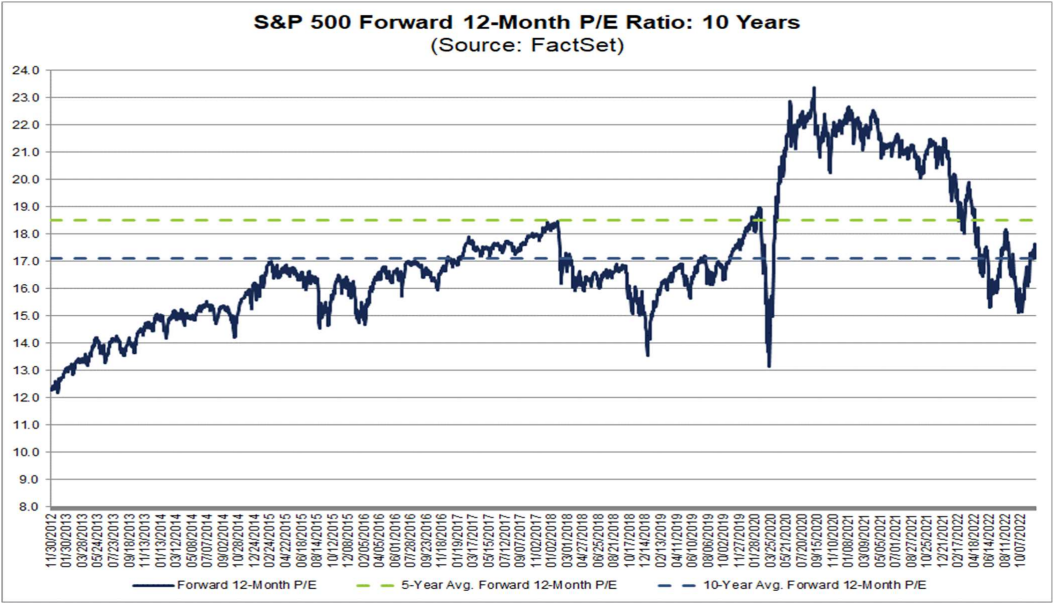
S&P 500 Forward P/E, Source: Factset
Disclaimer: The fully covered text is not investment or trading advice. It represents only the author’s point of view and thoughts, and we do not bear responsibility for your potential loss. The article serves only for analytical and marketing purposes.


Comments
Post has no comment yet.