During the last week, many things happened. The stock market rallied, mainly on Friday, when inflation expectations showed better figures. The most important data came out on Thursday and Friday, which helped to lift the markets.

Weekly Change at Stock Indexes and Current Bond Yields, Source: Author
The essential data last week in Europe
S&P global released the June flash PMI for the eurozone and USA on Thursday.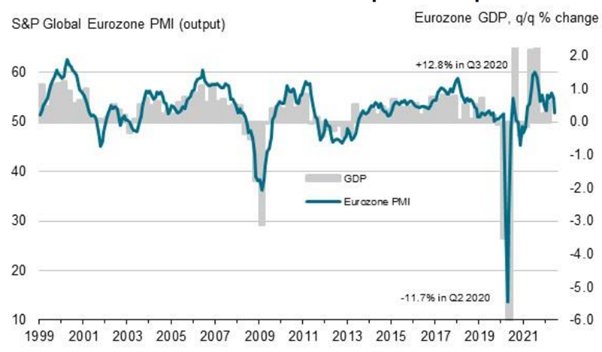
Source: S&P Global, Eurostat
“The seasonally adjusted S&P Global Eurozone PMI® Composite Output Index fell from 54.8 in May to 51.9 in June, according to the early ‘flash’ reading .”
According to preliminary PMI data for June, the eurozone’s economic growth drastically declined to a 16-month low, showing a slowdown in demand growth. The service sector’s growth slowed significantly, especially for services geared toward consumers while manufacturing production fell for the first time in two years.
Additionally, businesses reduced their projections for output for the upcoming year to the lowest level since October 2020. The growing cost of living, tighter financial circumstances, and worries over energy and supply chains connected to the Ukraine crisis and ongoing pandemic disruptions were widely cited for both the standstill of demand and the worsening outlook. Meanwhile, price pressures persisted at levels not seen before the outbreak. However, a third consecutive month of cost increase suggested a new inflation peak.
As a result, the stock market in Europe dipped on Thursday, as the increased probability of recession due to slower growth and inflation pressures remained elevated. Yields in Europe fall on this data and commentary. Thus, bonds saw some gains in the last week. However, there is a possibility of a turning point in bonds, as recession fear could pull down the yields.
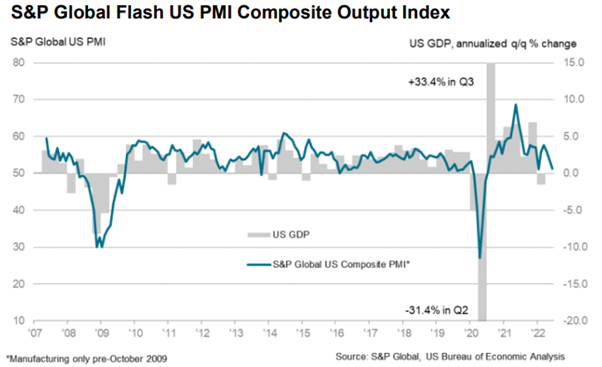
USA flash PMI for June
Source: S&P Global, US Bureau of Economic Analysis
The most recent “flash” PMI data from S&P Global indicated the smallest increase in US private sector output since the slowdown brought on by Omicron in June. With weaker service sector output growth and the first decline in industrial production in two years, the increase in activity was the second-weakest since July 2020.
In June, the headline Flash US PMI Composite Output Index fell from 53.6 in May to 51.2. The index result dropped, indicating a further slowing in the rate of business activity expansion to a pace noticeably slower than March’s most recent peak. The output was still rising, according to service providers, but it was the smallest growth in five months.
Manufacturers fared worse, with factory production falling as the corresponding seasonally adjusted index dropped to a level that has only been surpassed twice in the survey’s 15-year history, in 2008 during the height of the global financial crisis and 2020 during the size of the initial pandemic lockdowns.
Weaker demand circumstances caused the first decline in new orders since July 2020, frequently related to growing living expenses and declining confidence. For the first time since May and July 2020, new goods and services sales decreased in June.
What does this data mean? PMI New orders and overall PMI are continuously declining, the same as in Europe, signalling the worsened business condition, thus weakening GDP growth. Secondly, lowered production and demand will negatively impact the Earnings per Share of many companies, mainly manufacturers and services. Be aware of future EPS downwards revisions.
Suggested for you: EUR/GBP remains near cycle highs following a barrage of UK/EU data
The key driver of the market rally on Friday
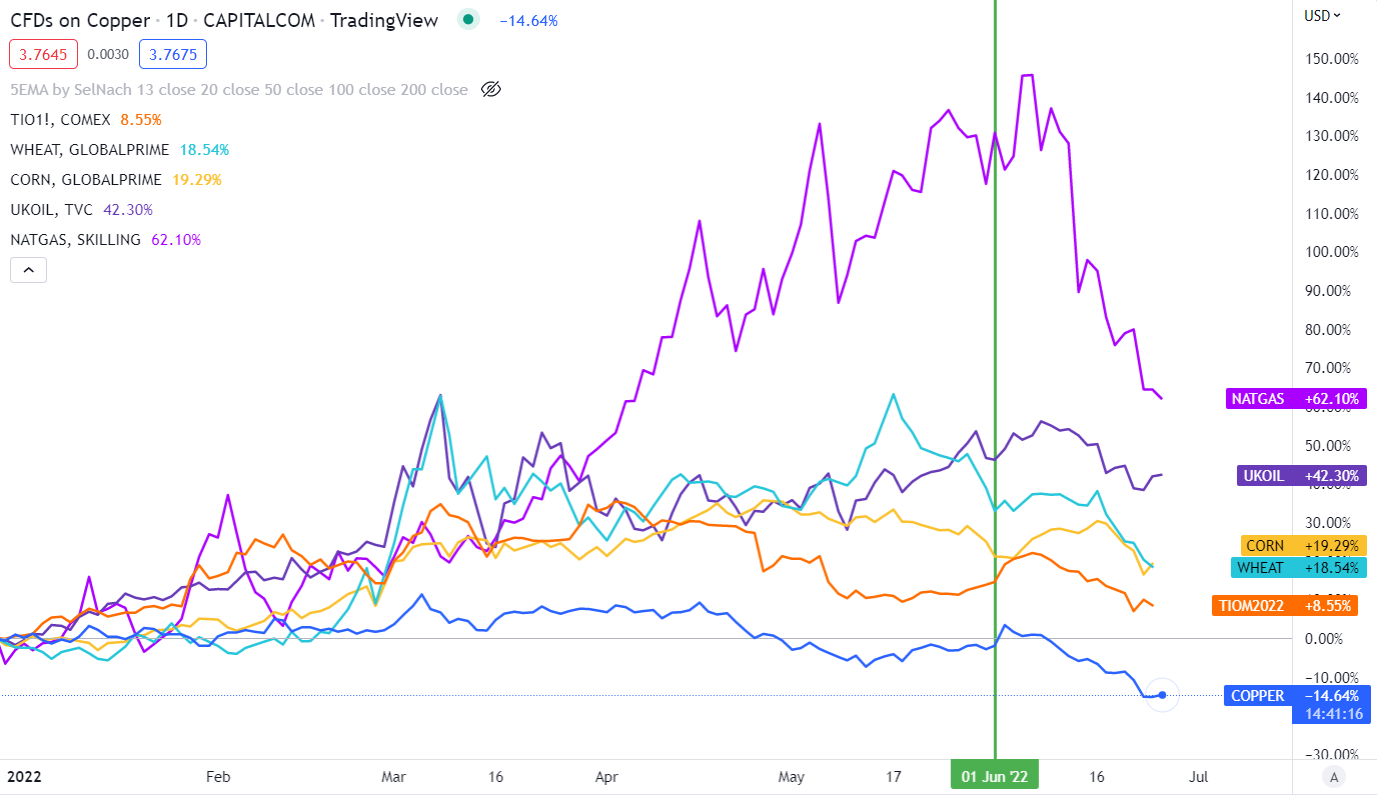
The market fully priced in Fed rate hikes and an aggressive move at 0.75% in June. However, it will help push consumer confidence to new lows and thus will aim to kill the demand side of inflation. Main commodity prices continued dipping last week as there were recession fears. Essential commodities, such as oil, gas, copper, and other industrial commodities, continued in free fall as the market expected a deceleration in economic growth, confirming the scenario PMI outlined. Commodities slump down can reflect that in May/June, we will find the inflation peak and possibly expectations an additional decrease in the inflation rate (monthly).
Prices of different commodities, Source: tradingview.com
Look what happened in June. All primary commodities continued in decline. It’s the reversion move of market expectations on the Fed funds rate, which has been rising. We can interpret it as an overall economic slowdown, which could lead to a slightly decelerating inflation rate. Secondly, the economy will probably find an inflation peak soon. Maybe not in June results, but with solid certainty in July/August, as there is a little delay (if the market would not significantly change the pricing).
Read also: Netflix announced another round of staff layoffs
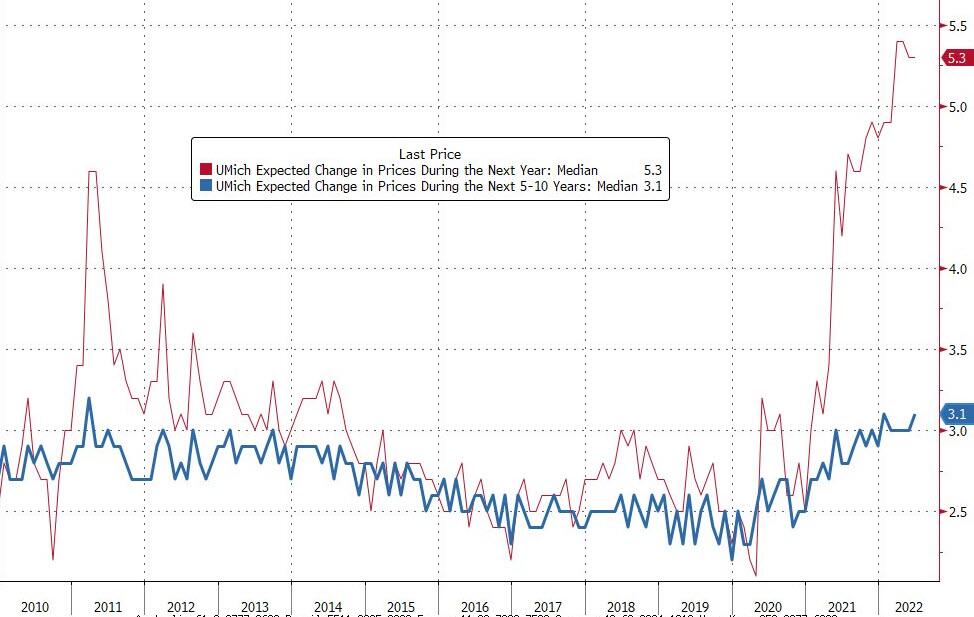
Fed monitors short-term and mid to long-term inflation expectations to optimize its monetary policy. It can be measured by the University of Michigan’s survey, released on Friday. The 5-10Y inflation expectation decreased from 3.3 percent in the preliminary data to 3.1 percent in the final data.
University of Michigan’s survey, Source: UM via Zerohedge
The market expected a shift to 3.3%, maybe even higher, but the results were slightly different. As there is only a tiny deviation, it simply implies Fed does not need to be more aggressive to deliver a stop-out of inflation rise. Demand-side destruction continues due to high prices caused by supply-side inflation, higher mortgage payments, and less money in the pocket of ordinary people. Just look at the chart below, confirming all the thesis. Consumer sentiment is near the financial crisis bottom, suggesting that when nothing happens and the fed tightens the monetary policy in an economic slowdown, it could cause a recession.
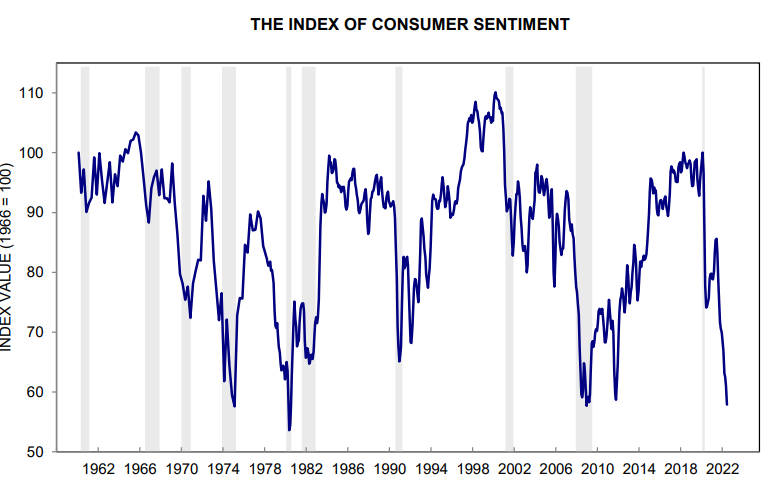
Source: University of Michigan
Trading Idea
However, a future expectation of recession will give the investors thoughts about long-term perspective. Maybe a short-term bullish rally for stocks as investors expect the aggressive monetary policy stance to ease. It would also be very bullish for bonds. However, in terms of P/E valuation, the indexes may now seem attractive.
Nevertheless, despite the index’s decrease of “P” (price), as confirmed by the PMI and weak demand from consumers, there is a strong probability of the “E” (earnings) being lowered and revised downwards. This makes P/E valuation not so great, and stocks may seem slightly overvalued relative to history. The rational positioning will be to move into US bonds with long maturities for a few reasons.
Firstly, the short-term economic slowdown will lead to lower long-term economic growth, thus should be bullish for bonds with extended maturities. However, recession or not, we see a substantial weakening of demand and, therefore, should aim for not fulfilling monetary targeting by the fed at 3.4% (rates) in 2022 and 3.8% in 2023. It also supports the thesis to move at US bonds with long-term maturities.
You may also like: Zalando: The fundamental bottom is near
This week, we have a few crucial data ahead. ECB’s President Lagarde will probably reveal an update on the new “fragmentation risk “caused by high yields, mainly on bonds (PIGS countries). Because the spread between German bunds and Italian bonds is significant, there may be some steps to flatten it. Be aware of further Powell’s speech on Wednesday and additional data such as preliminary inflation results for June in Europe and ISM Manufacturing PMI.
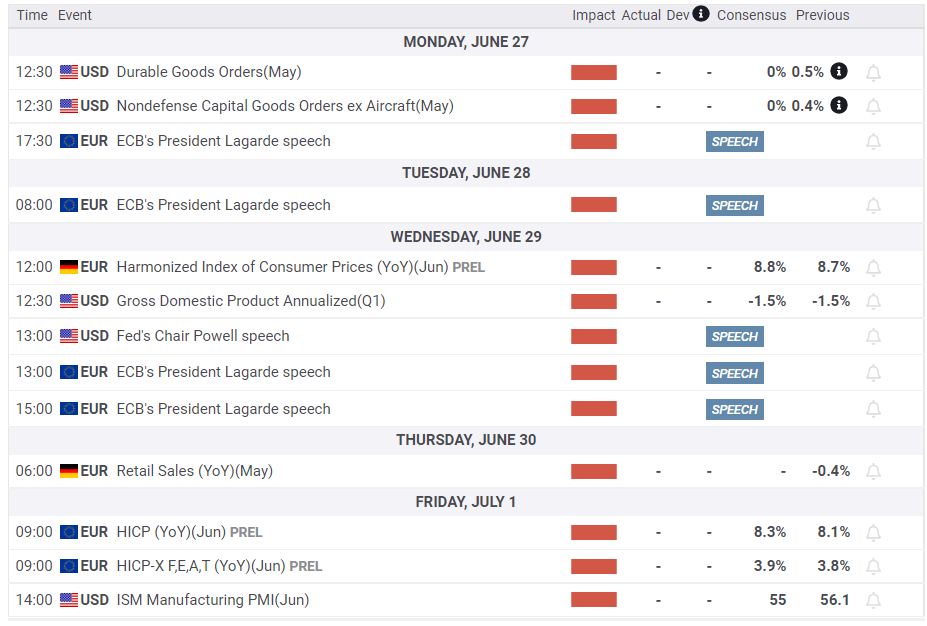
Economic calendar, Source: Fx street


Comments
Post has no comment yet.