The USD/JPY pair shot higher on Thursday as traders bought the pair following the highest inflation reading in 40 years. At the time of writing, the greenback traded above 116 against the yen, rising to one-month tops.
US inflation is not slowing down
The latest inflation report for January showed that the CPI inflation printed a shocking +7.5% year over year – the highest since March 1982. Again, food, energy, and used car prices were the most significant drivers. The energy index rose 27.0% over the last year, and the food index increased 7.0%.
The core CPI – excluding food, energy, and other “volatile” things – rose 6.0% yearly, also the highest since 1982. Both numbers came out above analysts’ forecasts.
CPI has beaten Wall Street expectations 9 of the past 11 months. That is the 20th straight monthly rise in CPI, with both goods and services costs rising.
“The stronger than expected January CPI report increases the odds of a firmer monetary policy response by the Fed. As a result, we continue to expect the FOMC to raise rates by 25bp at its March meeting. Still, another solid print in February will likely encourage the Fed to accelerate the pace of hikes in 2022 and hasten both the timing and pace of balance sheet runoff.” economists at TD Securities said after the report.
Today’s CPI print pushed the odds of a 50bps rate hike in March up from 30% to 55%, sending US yields sharply higher. The 2-year yield exploded 10% from 1.37% to 1.5%, while the 10-year benchmark yield attacked the psychological 2% threshold. Once the 10-year settles above the key resistance near 1.95%, we might see another leg higher, targeting the 2.2% level in March.
Since the USD/JPY pair is usually tightly correlated with short-term US yields, we have seen a strong reaction to the upside, despite the USD falling sharply against other major peers.
Daily chart appears bullish
Technically speaking, the pair is now testing previous cycle highs above 116.00. If bulls push the USD above that level, stop-losses of short positions will be hit, likely pushing the dollar further higher. In that case, the next target could be at 117.00. However, as we previously mentioned, further gains in US yields might send the USD/JPY pair toward 120 over the following weeks.
Additionally, the MACD indicator is also trending higher on the daily chart, supporting the bullish view.
On the other hand, the major support seems to be in the 113.50/114 region, and as long as the USD trades above it, the medium-term outlook seems bullish.
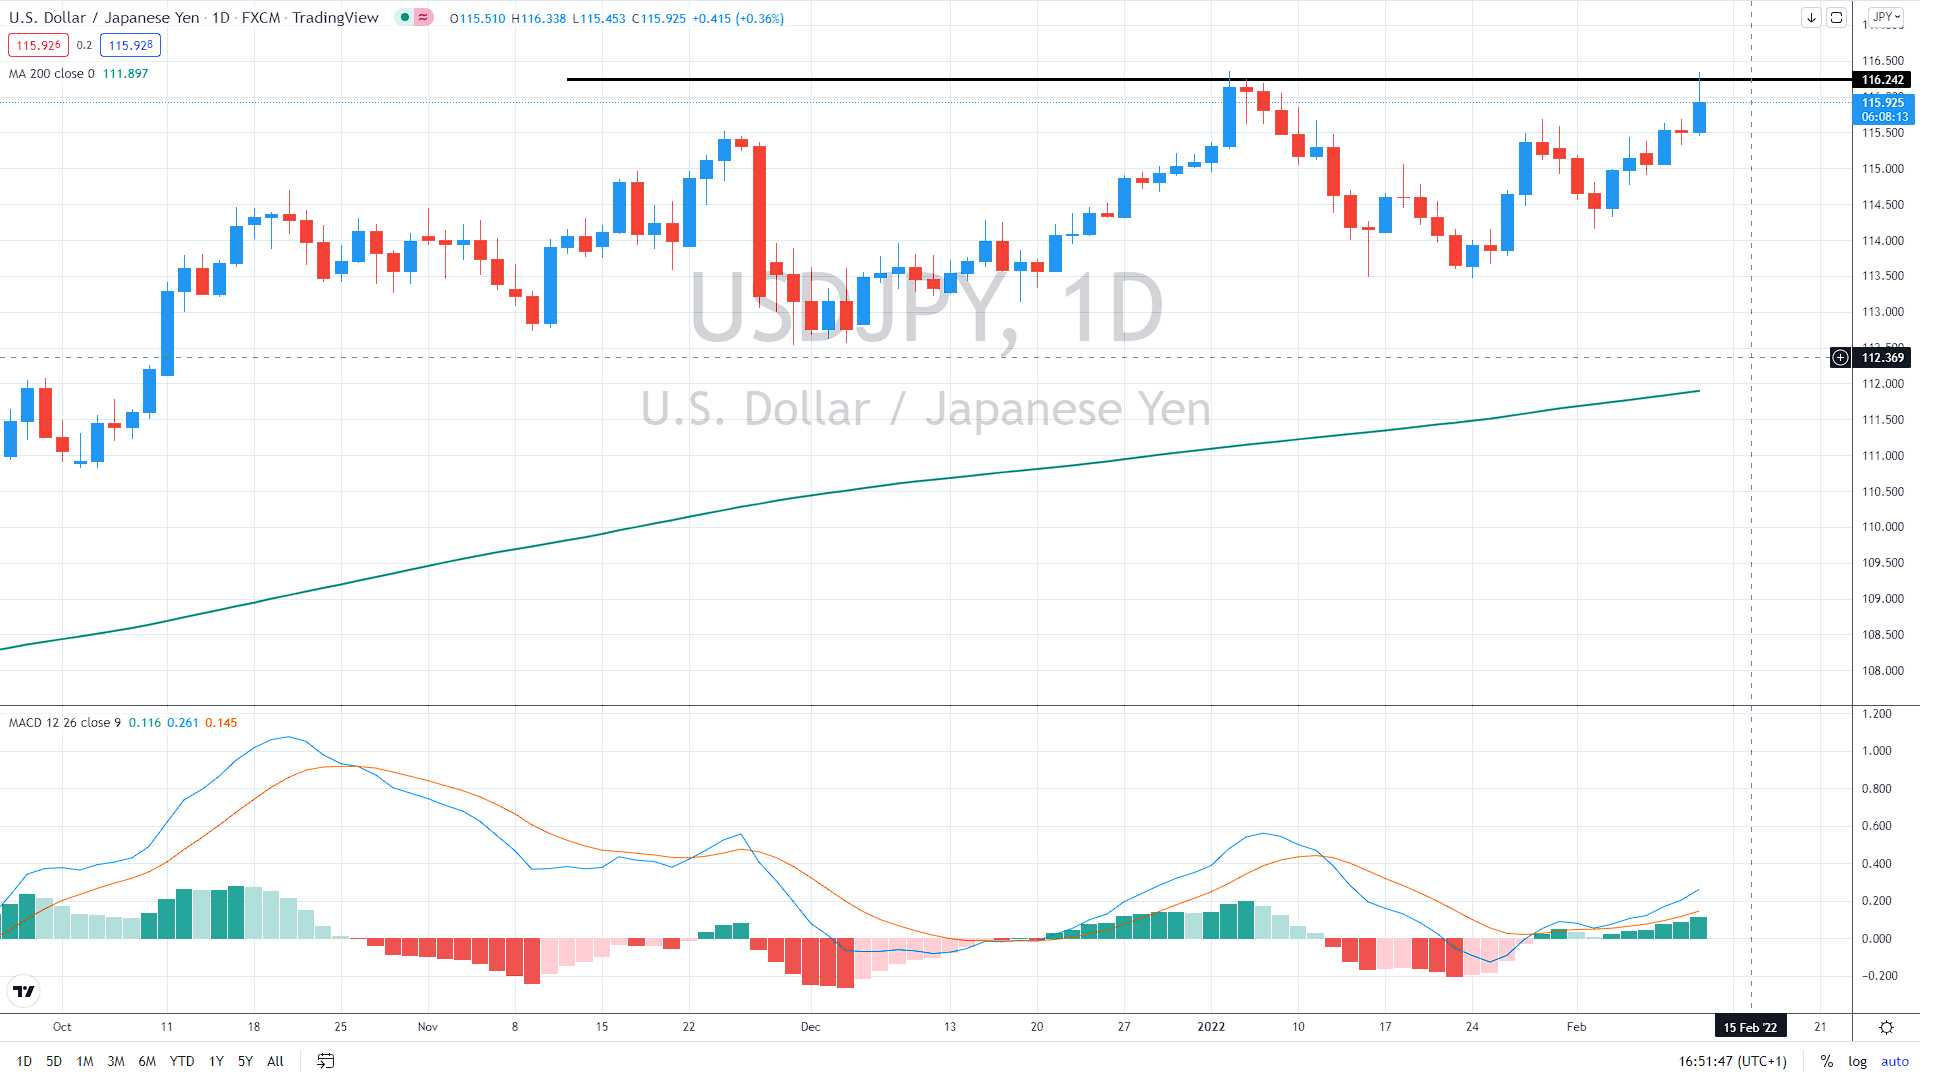
USD/JPY daily chart, Source: Author´s analysis, tradingview.com


Comments