The USD/JPY pair seems to be reversing the long-term uptrend as bulls have failed to push the USD to new highs. At the same time, a well-known reversal pattern has formed on the daily chart, implying a further downtrend in the coming days.
Fed remains hawkish
On Wednesday, the minutes from the Federal Reserve’s May policy meeting confirmed that the Fed will raise its interest rate by 50 basis points in June and July. Many participants felt inflation risks were biased to the upside, and a number of officials thought it would be prudent to explore selling mortgage-backed assets, according to the report.
“Participants agreed that the economic outlook was highly uncertain and that policy decisions should be data-dependent,” the Fed minutes added as a caveat.
The Fed’s major worry was inflation, which was exacerbated by the Russian invasion of Ukraine and China’s COVID-related shutdowns. Both crises have caused worldwide supply chain disruptions, which have pushed up prices globally. Officials from the Federal Reserve indicated that the pressures may relax at some time, but the timing and scale are “uncertain.”
You may also read: Oslo Freedom Forum – Day 2.
Later in the day, the US Bureau of Economic Analysis will publish its second estimate of first-quarter GDP growth, while the US Department of Labor will issue weekly Initial Jobless Claims data. The change in Pending Home Sales for April will be included in the US economic calendar as well.
“We think that the downside potential for the dollar is shrinking, especially given a more balanced positioning after a widespread position squaring and a still supportive Fed story,” said analysts at ING, in a note.
Head and Shoulders on daily chart
On the other hand, the daily chart looks otherwise as there is a massive head and shoulders pattern already validated by the price action. The neckline of the formation is at 127 and as long as the USD trades below it, the pattern could be active.
The full potential of the formation is circa 400 pips, thus targeting 123 in the following weeks. Alternatively, if the USD jumps back above 127, it could rally toward 128. Only a break above 130 would invalidate the current head and shoulders pattern.
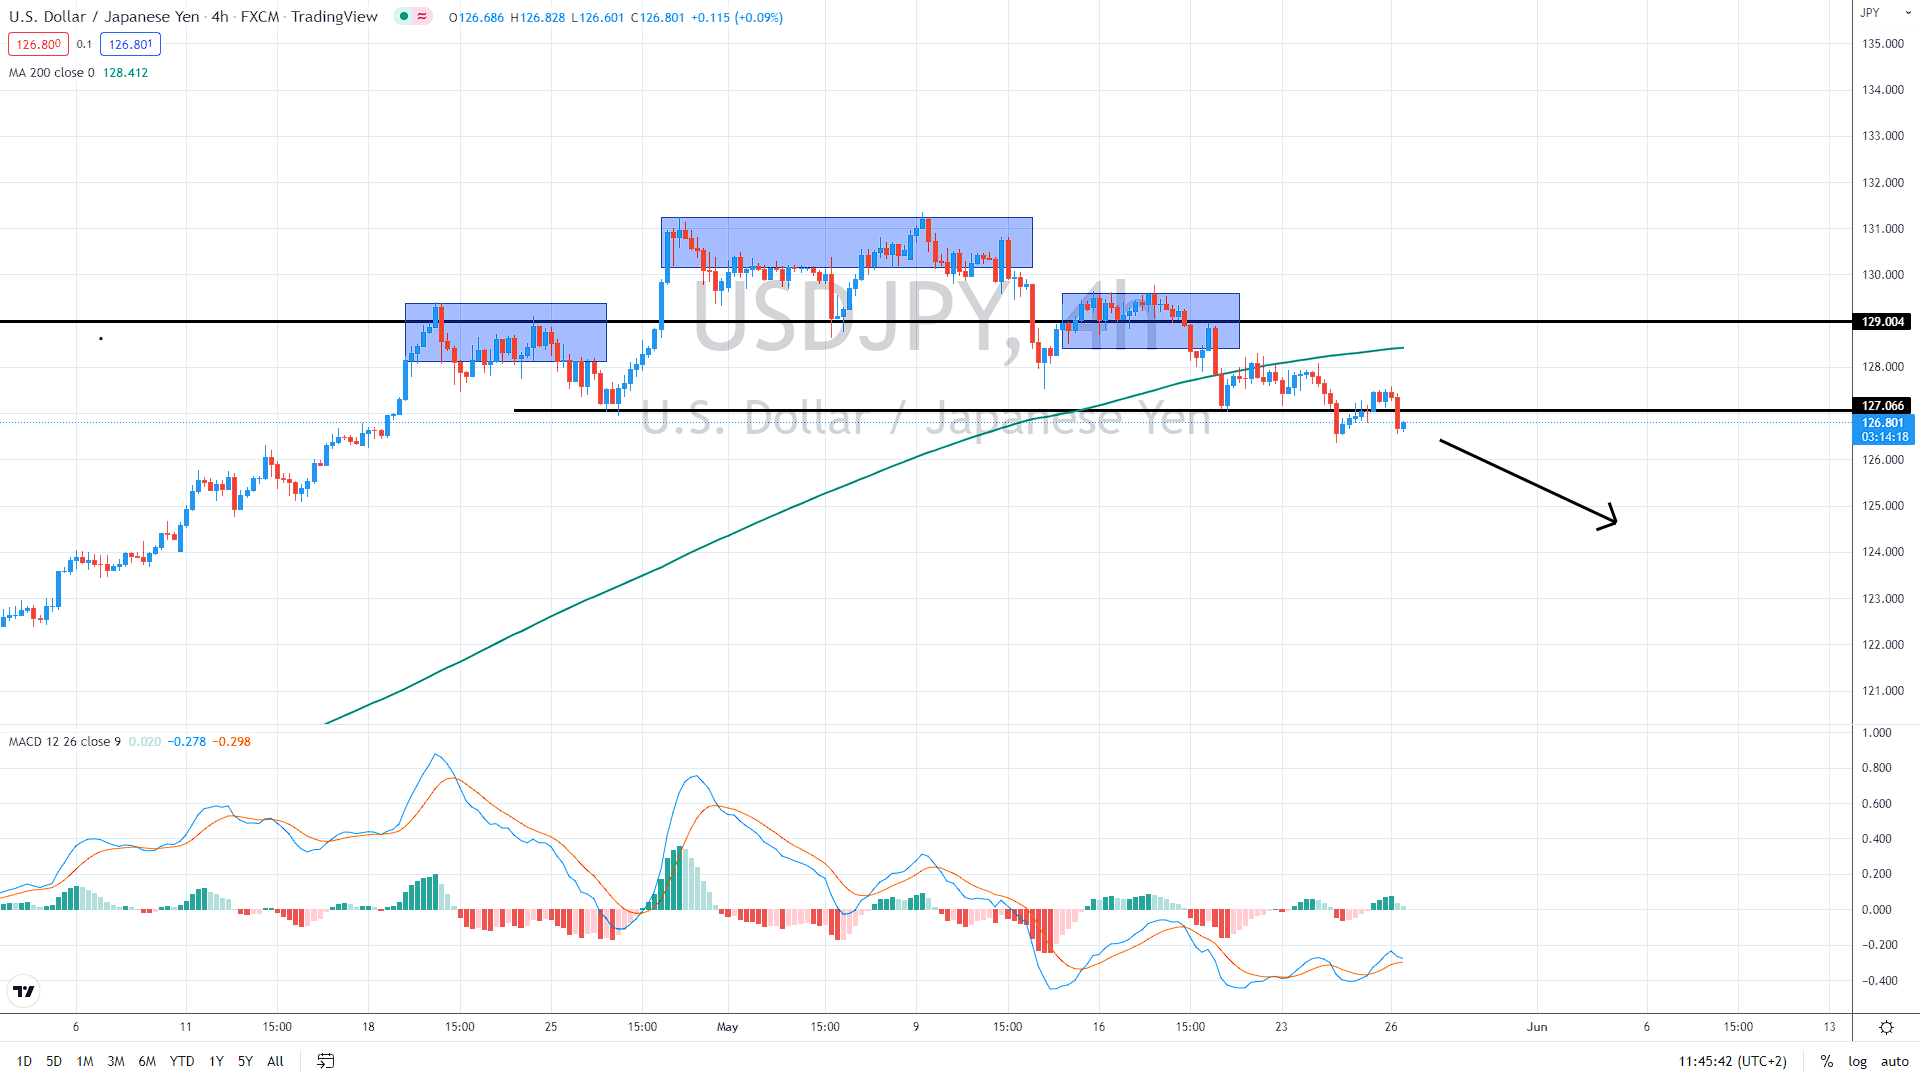
USD/JPY daily chart, Source: Author´s analysis, tradingview.com


Comments
Post has no comment yet.