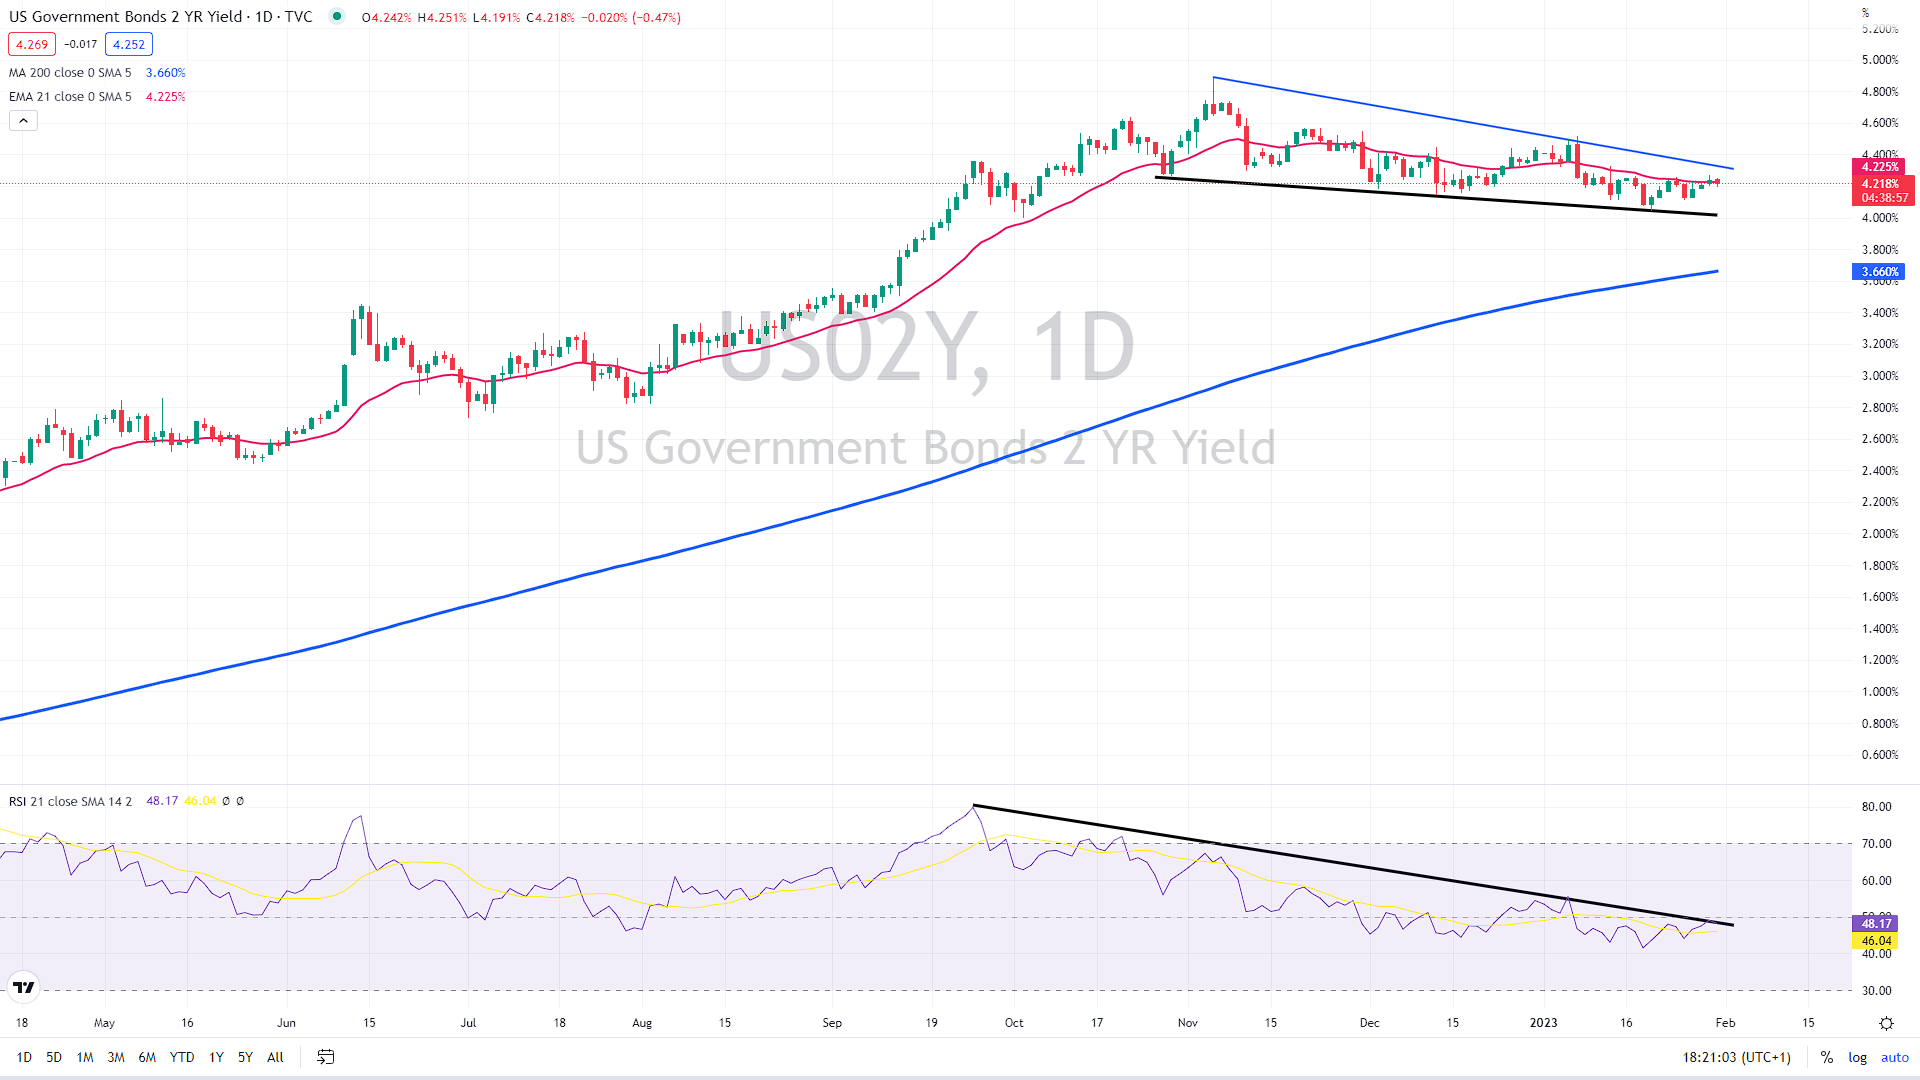
US bonds have not moved anywhere over the previous weeks, and the 2-year yield traded in the 4.3% region since November 2022 as investors still need to decide which way to go.
US data recap
The Q4 US employment cost index (ECI) climbed 1.0% quarter-over-quarter (somewhat less than the +1.1% predicted and under the +1.2% quarterly in Q3).
Six consecutive quarters have seen labor prices increase by at least 1%, extending what was already a record-setting string of data dating back to 1996.
As a reminder, Fed Chair Powell specifically addressed this signal, and while the quarterly changes are heading in the correct direction, we see that the year-over-year rate of change jumped to a new record high of 5.07%.
Furthermore, after an unexpectedly robust comeback in December, Chicago PMI dropped in January to 44.3 (below forecasts of 45.0), marking the fifth consecutive month below 50, thus, staying in recession territory. Since the Great Financial Crisis, this has been the longest run of contraction readings.
You may also read: Gold is steady before extreme macro week
Lastly, analysts anticipated a little improvement in The Conference Board’s Confidence Index in January, with the current scenario being relatively stable in light of the economic upheaval observed elsewhere in the United States.
The actual print fell short of expectations (107.1 versus 109.0 forecast), which was caused by a decline in the Expectations subindex (from 83.4 to 77.2) and an increase in the Present Situation gauge (from 147.4 to 150.0). The Present Situation is at its highest since April 2022.
Fed should set direction
The most important event on the schedule is the FOMC’s policy meeting, which begins on Tuesday in advance of an expected decision to raise rates by a quarter percentage point on Wednesday, raising the federal funds’ target range to 4.5 to 4.75%.
“[We] expect Powell to be quite hawkish in the press conference,” Michael Feroli, chief U.S. economist at JP Morgan, wrote in a note. “We look for him to stress two themes: (i) slowing is not stopping, and (ii) don’t expect rate cuts in ’23.”
The 2-year yield remains stuck within a massive flag pattern, which, in this case, appears as a continuation of the bull market in yields. If the yield jumps above 4.5%, it might continue higher toward 5%.
On the other hand, a break below 4% should send the yield down to the 200-day moving average (the blue line) near 3.66%.

US 2-year yield daily chart, source: author´s analysis, tradingview.com


Comments
Post has no comment yet.