Another day, another cycle highs in US yields, with the 2-year yield pushing toward the 1.40% level for the first time since February 2020. At the same time, the 10-year yield was seen testing the critical resistance near 1.95%.
Inflation remains hot
The US CPI inflation is due on Thursday, expected to accelerate further higher to 7.3% year-on-year, up from 7.0% in December. The core indicator is also forecast to continue rising and print 5.9%, against 5.5% scored previously. On the other hand, monthly changes will likely decline very marginally.
That could be another bearish signal for US bonds, pushing their yields further higher.
There is a significant resistance near the 1.95% for the 10-year US yield. That level represents 2019 lows and 2020 highs, thus, creating an extreme threshold for bond bulls to defend it.
But, as Bloomberg’s Ed Bolingbroke notes, that level also represents a milestone where mortgage bond funds would be compelled to sell Treasuries to protect their portfolios against the effects of rising yields, according to strategists.
Investment banks see yields spiking further
Considering a possible uptick in inflation in this week’s report and rising chances of a 50 bps at the March meeting (currently 30-50% odds as priced by rates derivatives), we might see a quick leg higher above the mentioned 1.95% resistance.
Additionally, Citigroup expects the US yields to surpass the closely-watched 2.0% psychological level soon as the Federal Reserve battles the hottest inflation since the 1980s, with Matthews International Capital Management anticipating a move toward 2.5%.
“It’s only a matter of time — I don’t see any favors coming through for Treasuries, especially with the synchronized hawkish pivot of central banks such as the ECB joining the chorus of the Fed,” said Vishnu Varathan, head of economics and strategy at Mizuho Bank, who sees yields testing 2.5%.
JPMorgan Asset Management is the most bearish (for now), warning that the global bond benchmark could test as high as 3% this year.
The weekly chart shows that the 10-year yields continue to advance, breaking above the mentioned resistance. Moreover, the weekly chart looks like a massive rising triangle pattern, a bullish formation. The potential of this formation is enormous.
According to this chart, once the yield settles above 1.95%, it could move higher toward 3%. Therefore, more selling pressure could hit risk assets such as stocks and commodities.
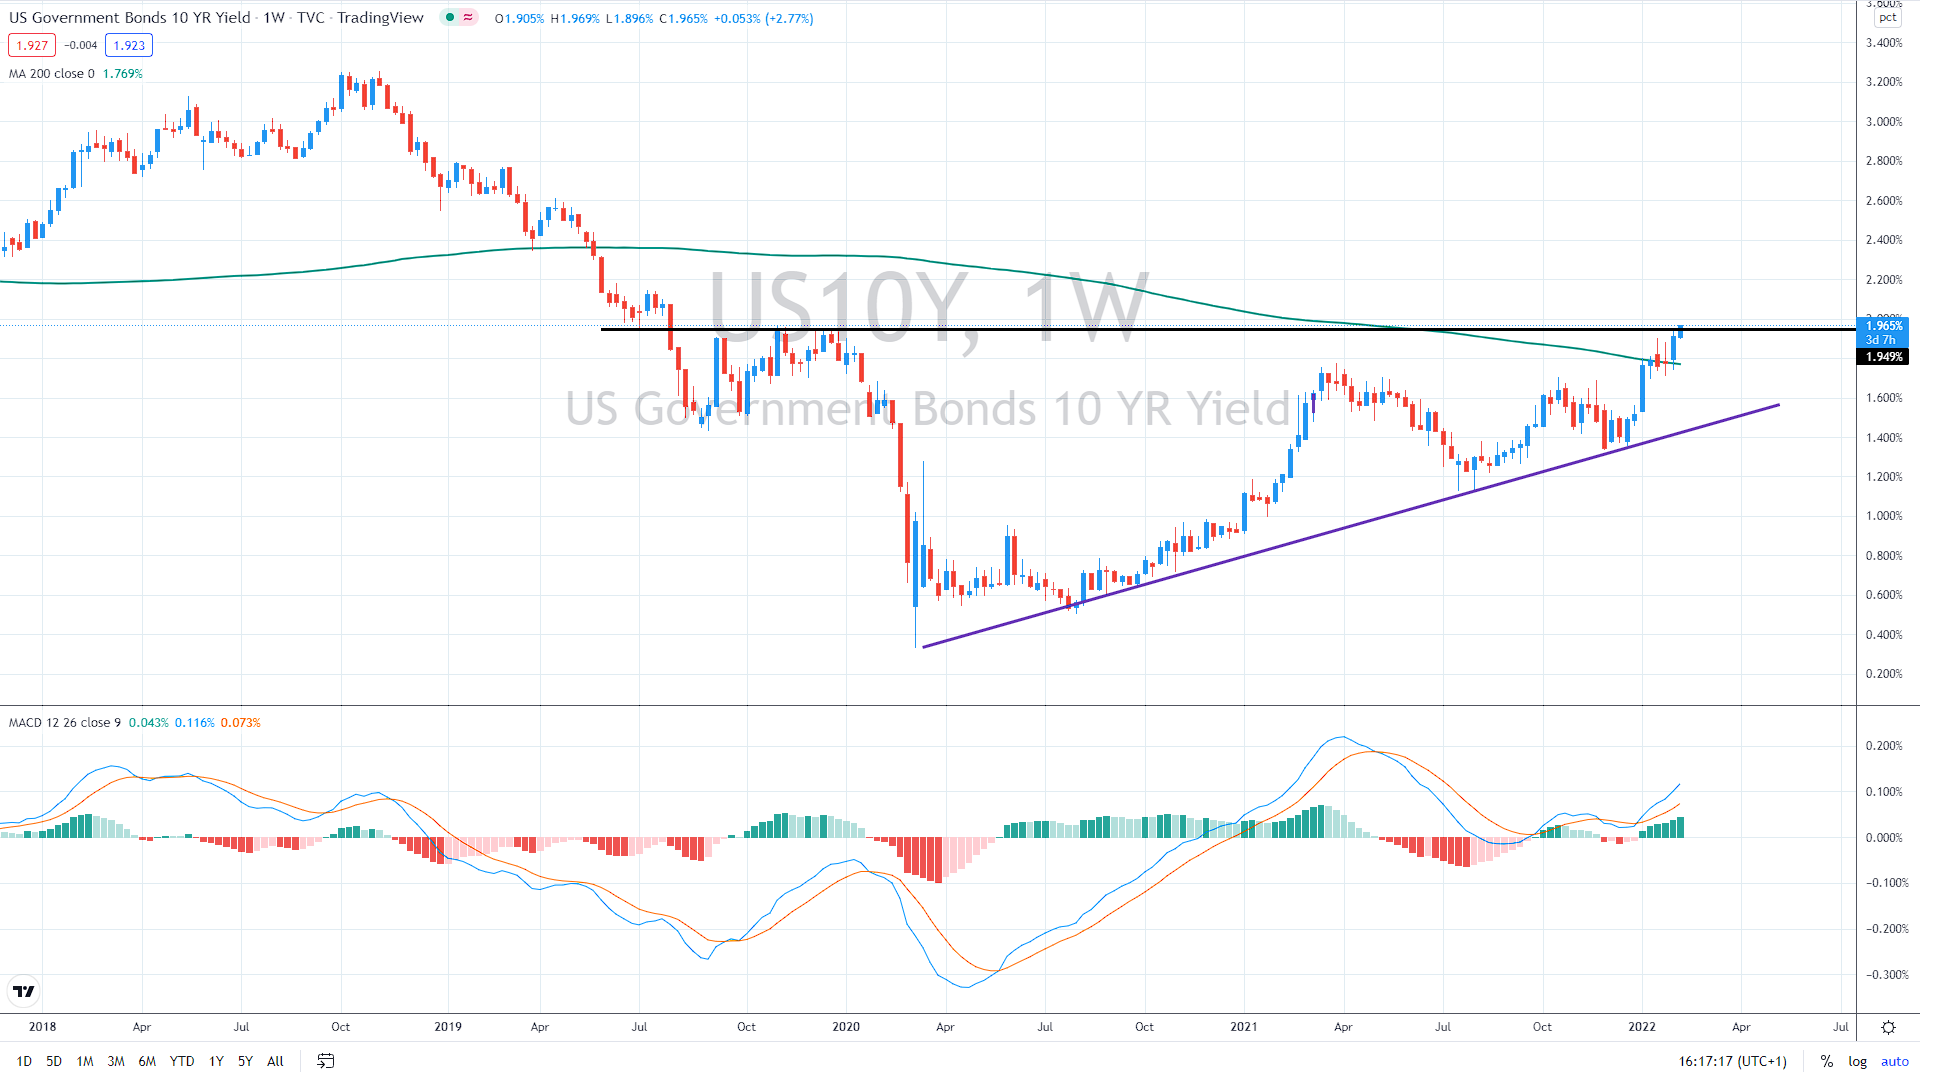
US 10-year yield weekly chart, Source: Author´s analysis, tradingview.com


Comments