Looking at stock market developments in the UK in recent years, returns have been lower compared to European countries and the US. This in turns creates a better chance of a higher future return. In addition, the all-time highs were created in 2018. The current price of UK 100 is 7 099 (March 10, 2021). Let’s now look at statistical and technical analyzes.
STATISTICAL ANALYSIS
Based on a long-term analysis of historical data, the average positive and negative daily returns are approximately 0.78% and -0.81%, respectively. The estimated daily return in both directions based on their probability of occurrence is 0.40% and -0.39%. Yesterday´s return was -1.51%, which is between the first and the second standard deviation. Our scoring is currently neutral (0) for the month-on-month change and 0 for price indexation. Both scorings range from -3 up to 3, which means that we still estimate an extreme negative phase of the cycle. The development of the estimated cycles based on our analytical system is shown in the following chart.
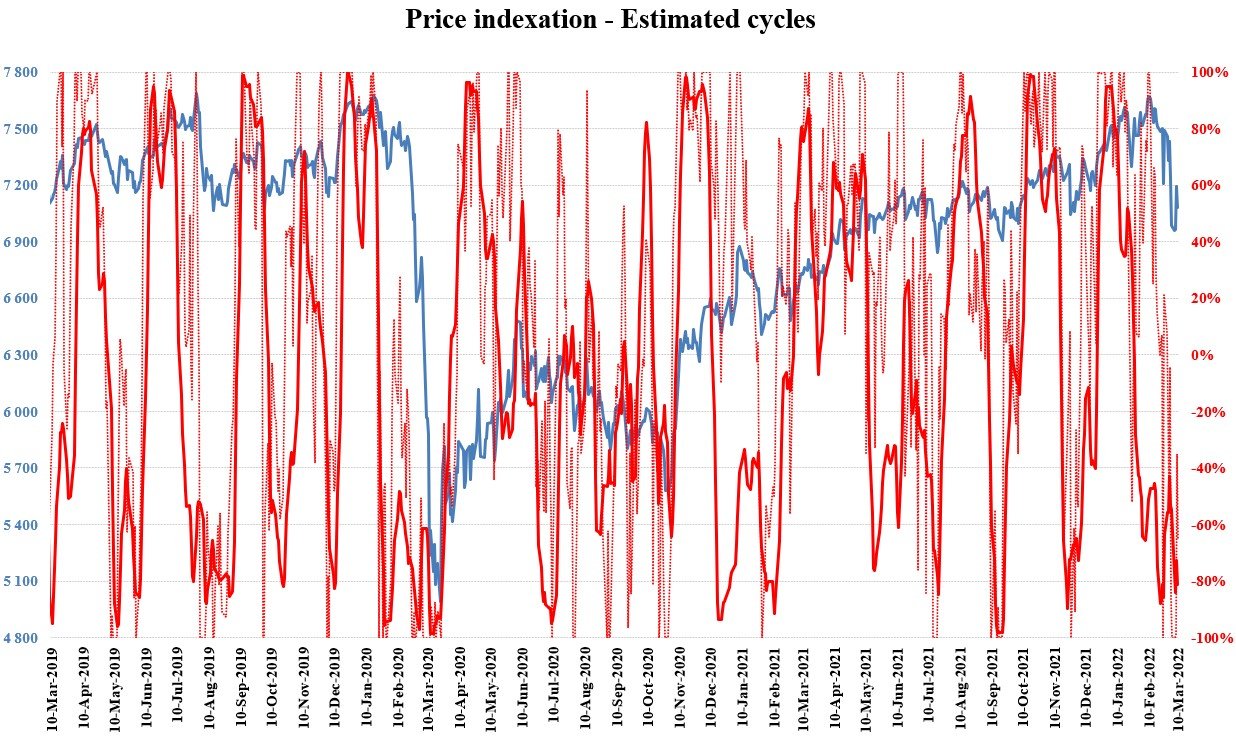
Source: WALFIR
Different moving averages (MAs) help us better identify trends across multiple time frames. We use 3 basic MAs to find out which sentiment dominates each horizon. The purple line represents the monthly , the green line the 6 months and the yellow line the annual moving average. According to all MAs, the UK 100 has bearish sentiment because it is below them. In the case of growth, the annual MA may be a resistance to the market price.
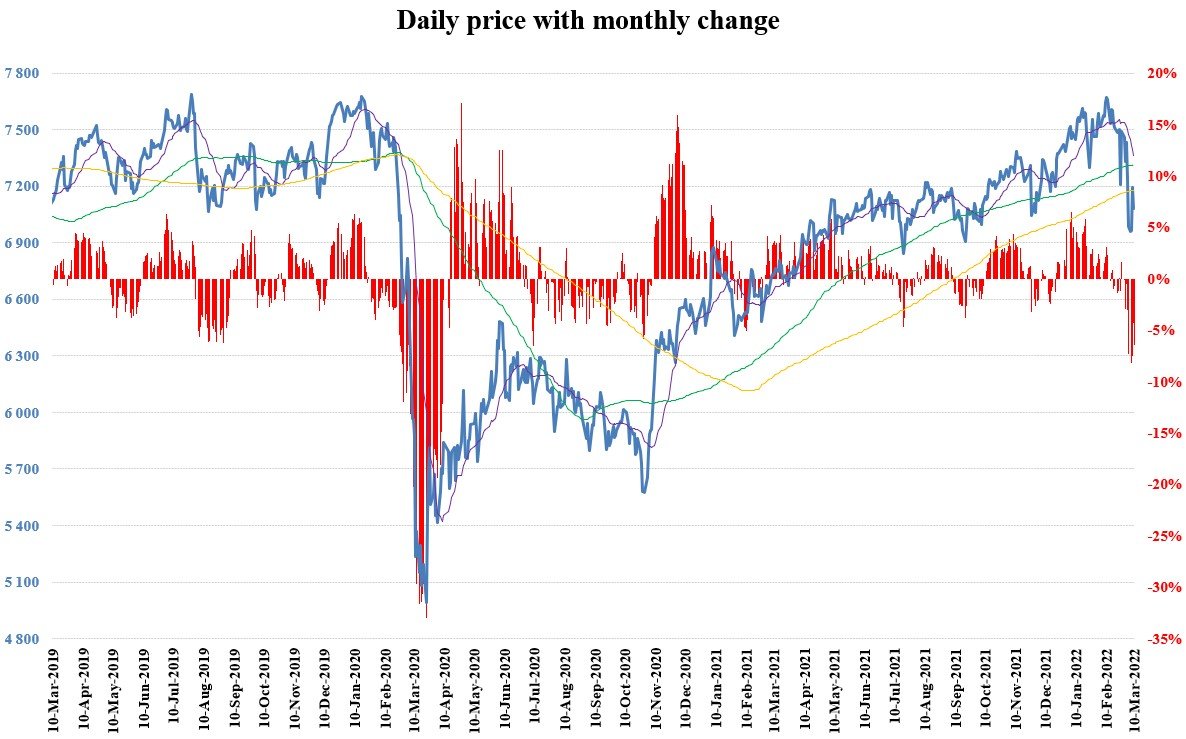
Source: WALFIR
Since the beginning of this year, we have witnessed more downward trends, with the maximum level reaching 3 consecutive days. The maximum decrease is 6 days in the measured period. The upward trend in recent weeks have not exceeded more than 2 days. However, the maximum for the last 3 years is 10 days. We could use the average long-term ATR (Average True Range) obtained from daily data (1.11%) to estimate Stop Loss orders for our positions. The current value is 2.54%, which is twice the average. Approximately 90% confidence interval (return between -1.80% and 1.80%) is shown in the histogram below by a red rectangle.
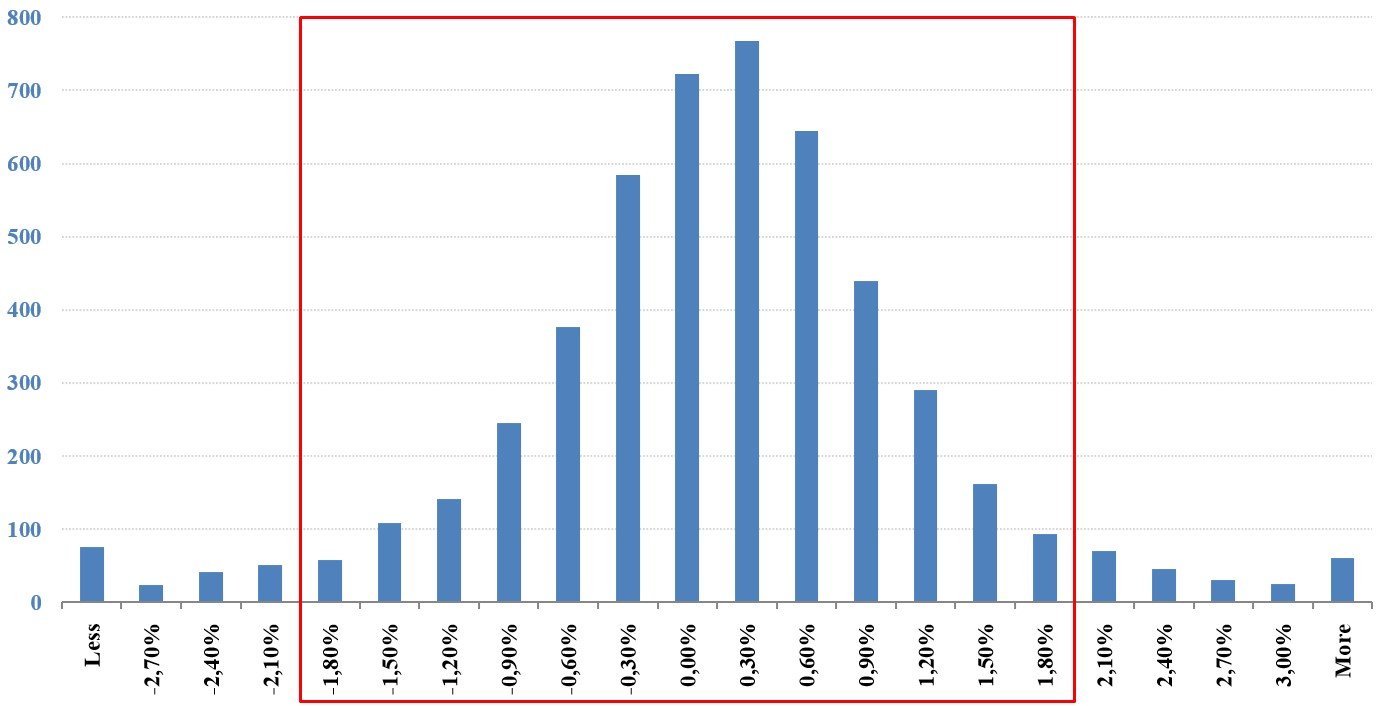
Source: WALFIR
We could use the last decile of low to high returns (2.50% ) to estimate Profit Targets, as shown in the chart below.
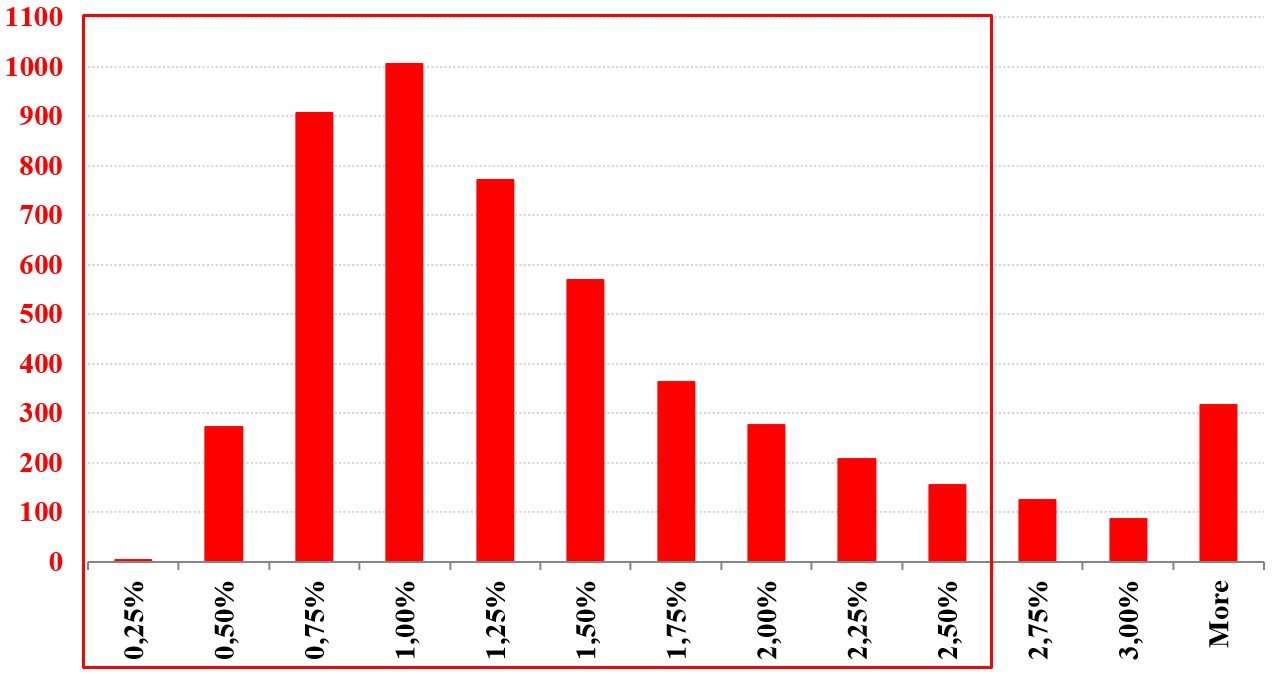
Source: WALFIR
TECHNICAL ANALYSIS
Basic technical analysis still supports short-term bearish sentiment as the market price creates lower lows and lower highs. UK 100 is currently again above the important psychological level 7 000 and 23.60% Fibonacci retracement level. This area could support the bulls as the market was traded there for almost ¾ of 2021. However, it is still below the short-term and long-term moving averages.
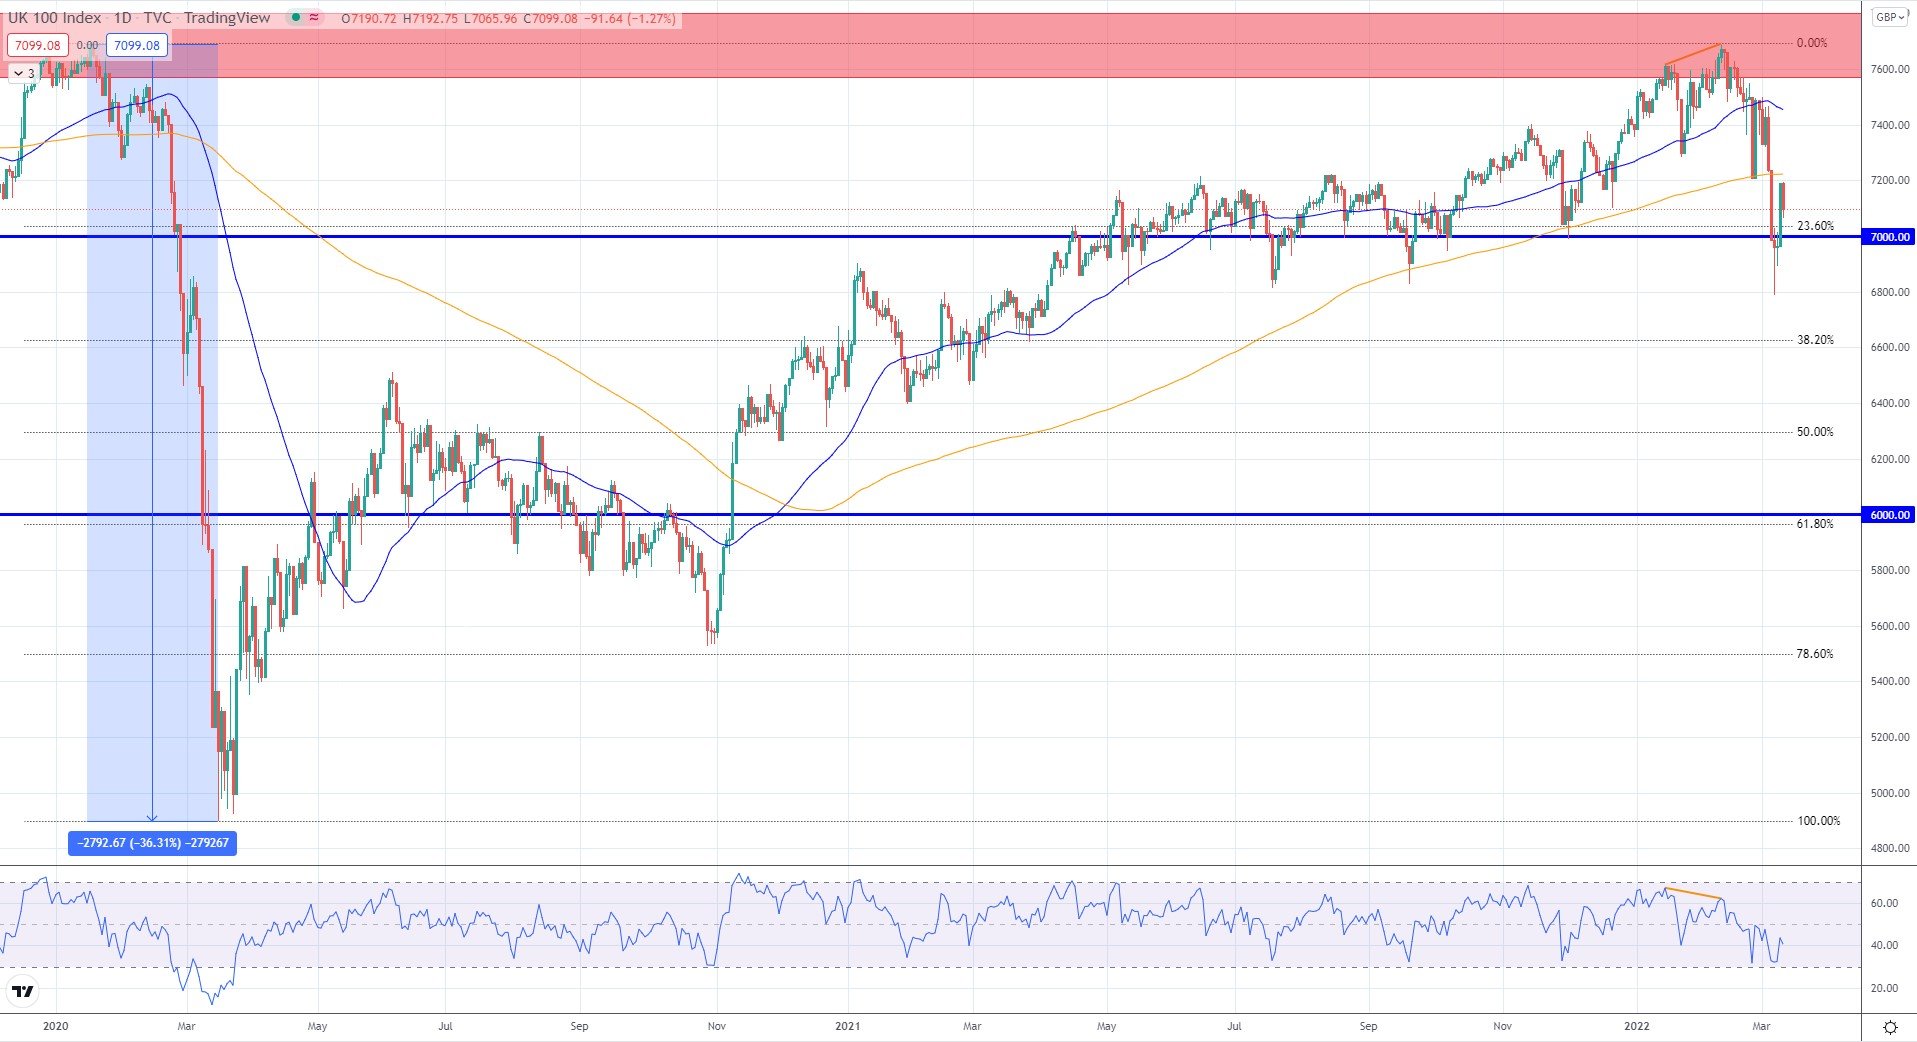
Source: TradingView


Comments