The demand destruction
OPEC released press news about the current situation in the oil market. But, unfortunately for readers and traders, those news had contradictory meanings. The organization explains the production cut of 2 million barrels of crude oil from November.
The reason is the big surplus of the commodity, as the surplus is not just for the current period but for the beginning of 2023 as well. The cut was quite the opposite of the proposal of the USA in an attempt to lower the price of crude oil.
Related article: Crude oil falls down despite tight production policy
The USA’s anger was significant by US president Biden’s comment. He stated that there would be “consequences” for this step. However, the message from OPEC is clear: we have a surplus and we need to make cuts.
With the recession in Europe and heading toward recession in the USA, the demand for crude oil shows potential worries. China’s last economic data did not go well, so producers and traders are nervous about the price.
OPEC’s mixed projections
Contrary to the news of an enormous surplus of the black commodity, OPEC released its projection about the rising crude oil consumption of about 13% in 2035. Moreover, the projection says that the transition from oil could be dangerous. In addition, the biggest problem of fossil fuels is seen in the changing climate situation, which could lead to turning to less carbon energy.
Read more: These 3 stocks are safe-haven amid recessions
Adipec energy conference in Abu Dhabi brings contradictory news. Firstly, the commodity’s demand destruction as the reason for a production cut. Secondly, the message says producers expect a rise in demand in the next 13 years.
Technical analysis
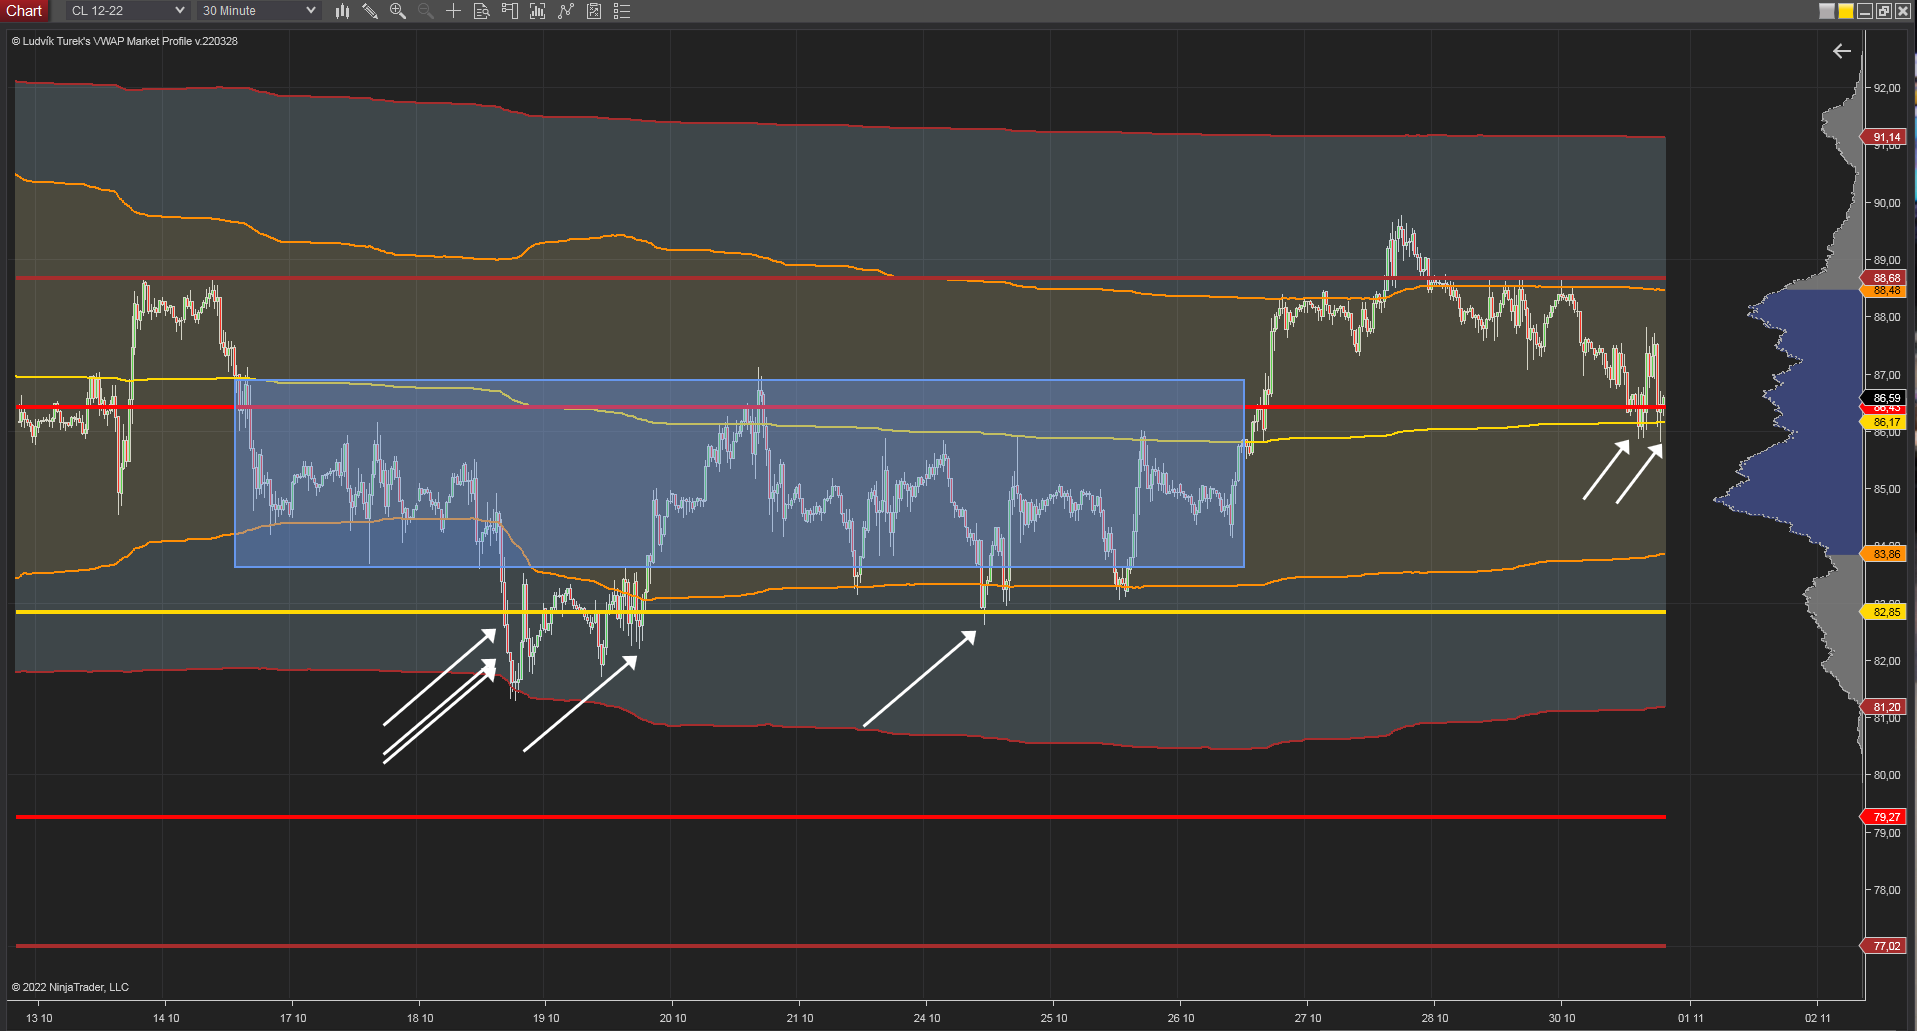
Technical analysis shows interesting development in the last two weeks. We pointed out the area of interest between $83.50 – $87. On the 26th of October, the price elevated from the area to the level of $90. The mentioned area became support for the price of crude oil. To add, the developing VWAP of this month is $86.17, which builds another support level for the black gold. The next support could be at the level of $82.85, which worked numerous times.

30 minutes chart of CL (Crude Oil Futures), Monthly VWAP. Source: Author’s analysis
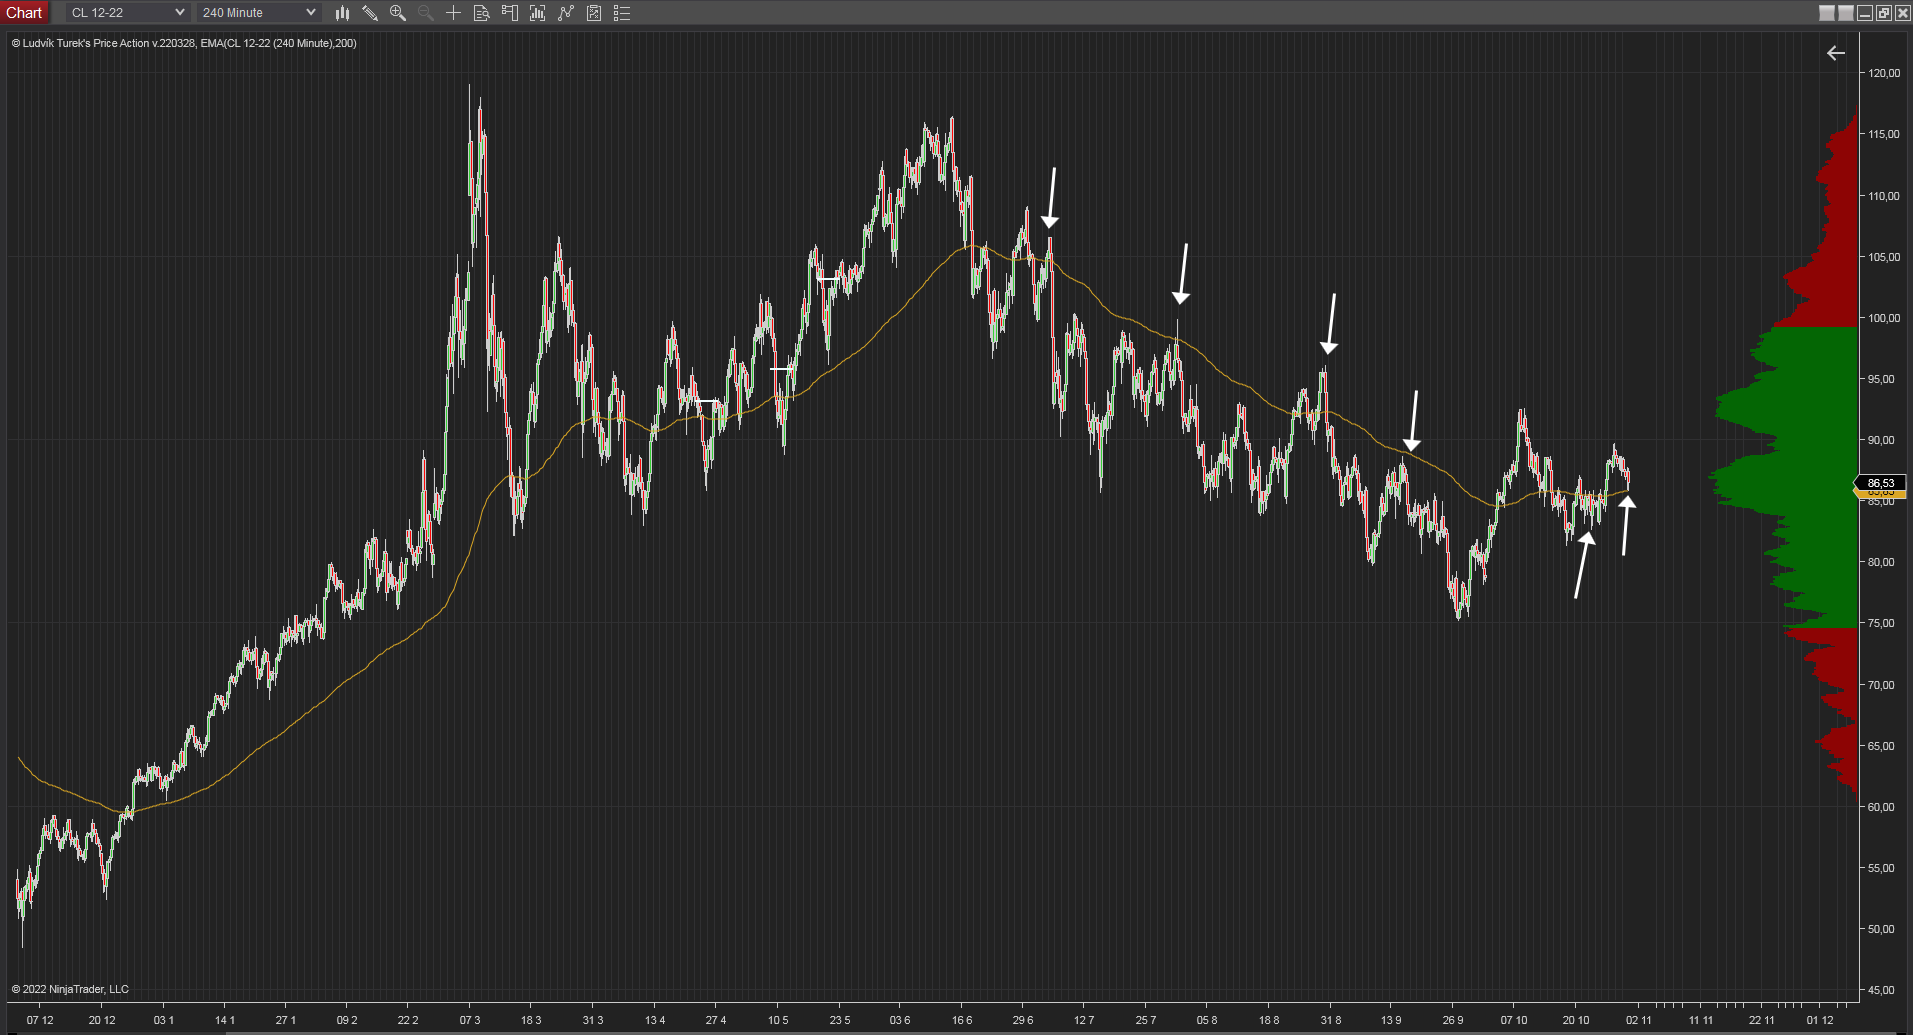
It is interesting to follow the 200 Exponential Moving Average indicator from the longer time period. In the 4 hours chart, it is clearly seen how this indicator works with the price development. Moreover, the price of crude oil tried to break above this indicator, which could signalize the attempt to change the five months-long downtrend.

240 minutes chart of CL. 200 EMA development. Source: Author’s analysis
Destiny of Russian oil
Russia has a big question: what to do with the 1.4 million barrels of crude oil per day which were shipped to Europe? The deadline is December 5th, when the EU sanctions will come into effect. Of course, EU is not the only client of Russian oil, but those 1.4 million barrels need to be allocated elsewhere.
Russia has one month to enter new markets or persuade current consumers to raise the shipment. The potential shortage of crude in Europe can affect the development of the price of a commodity.


Comments
Post has no comment yet.