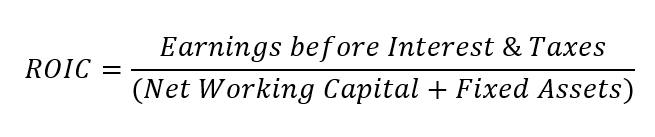
In our opinion, one of the best useful tool to compare and measure a company´s financial performance efficiency is ROIC. In case of ROE we can calculate with shareholder´s equity, but it is not taking into consideration debt and other liabilities. However, ROIC ratio is taking into account current liabilities also. The next is here:
Source: Steady Compounding
An ROIC higher than the cost of capital indicates that the firm is healthy and growing. In contrast, ROIC that is lower than the cost of capital means that the business model is unsustainable. You can compare it with the company’s WACC. That’s the general rule. However, numbers can differ among the sectors.
When a company’s return on invested capital (ROIC) is higher than its weighted average cost of capital (WACC), which is the most common measure of cost of capital, value is created, and the companies trade at a premium. A return that is two percentage points higher than the firm’s cost of capital is a common way to show that value is being created. Some businesses operate at a zero-return level, which means that although they aren’t destroying value, they don’t have any extra cash (from its operations) to invest in future growth.
ROIC = TTM EBIT / (Total Current Assets – Total Current Liabilities) + Long Term Assets
Paypal ROIC = 4.05Bn / (52.5 Bn – 43.03) + 23.2
Paypal ROIC = 12.3 %
Unfortunately, there is also different calculation for ROIC, with different variables, but its also useful. According to our opinion, the formula below is better, because it catches the company´s investing activity directly.
ROIC calculation according to Gurufocus:
ROIC = Operating Income * (1- Tax Rate) / Average Invested Capital (Invested Capital 2020 + 2021)
Invested Capital = Total Assets – Accounts Payable & Accrued Expense – Excess Cash
ROIC (gurufocus) = 16.8 %
WACC (gurufocus) = 8.7 %
This result implies that, for each method, where ROIC = 12.3% or 16.8%, it is still higher than WACC (8.7%); thus, Paypal is performing well and creating great value. This number is in general very satisfying, but it is also good to compare it with the company´s peers.
If you go to the gurufocus website – great analytical website, you can find current data. However it is limited for free use. However its worth to pay for that data and for whole insights you can reach from that website. According to Gurufocus, the Alibaba results are as follows:
“As of 2022-06-08, Alibaba Group Holding’s WACC % is 5.86%. Alibaba Group Holding’s ROIC % is 4.41% (calculated using TTM income statement data). Alibaba Group Holding earns returns that do not match up to its cost of capital. It will destroy value as it grows.” First look is not great from this point of view, but as we told you many times, If you want to be sure you did everything right, make a competition comparison, and you may find that Alibaba’s results may not be as bad as relative to its peers.
Below, we calculated average and median results from the Alibaba sector (approximately 12 companies). Alibaba is winning almost in all metrics. You can download data from Finviz for free (there are some limitations).
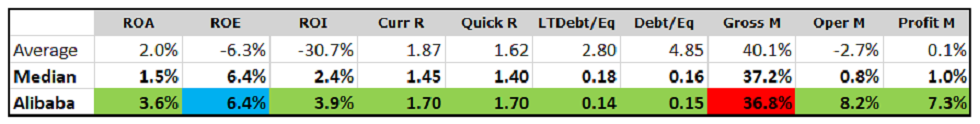
Source: Author’s calculations based on Finviz database
Helpful source used in this capitol: Investopedia
As you can see, Alibaba has much greater results compared to its peers as many crucial metrics are much more positive than the industry´s average and median. We highly recommend you to do a “scoring approach” we mentioned in the Balance Sheet part. This is the final part of the course and hope you enjoy it!

Comments
Post has no comment yet.