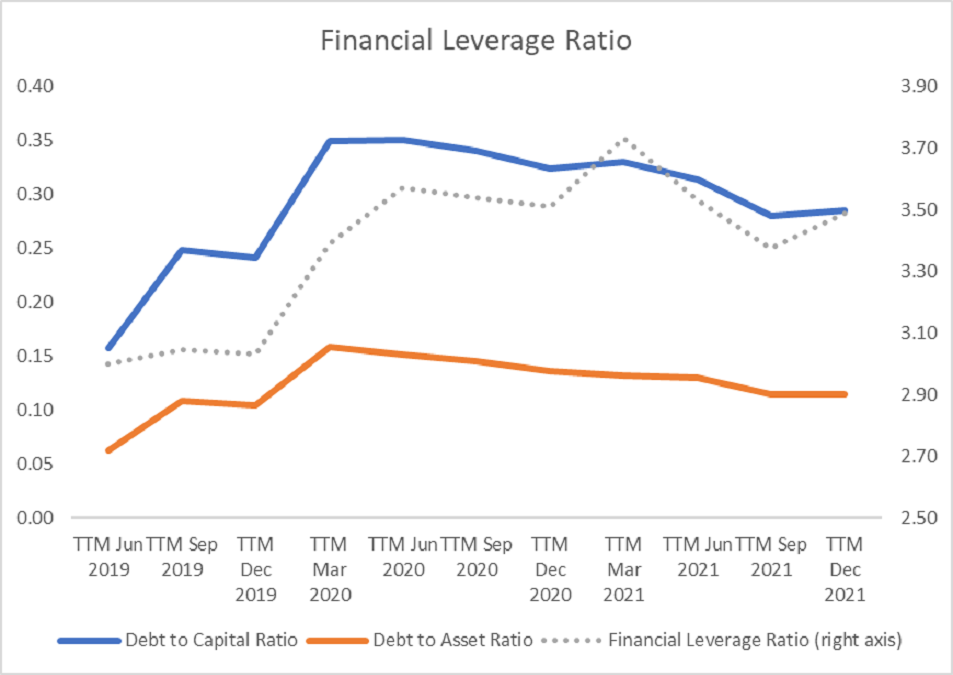
When these stepsare done, we need to move on to our financial leverage ratios. We can see the chart output here:
Source: Author’s calculation using SeekingAlpha’s database
We would start with the Debt to Capital Ratio. We need to put into consideration here the ratio between short and long-term debt and capital leases (as total debt) to total debt + equity. It represents the % of debt on total capital in a company. Currently, it stands at 0.29, which means that 29% of a company is financed through debt. This result is undangerous.
If we check the Debt to Asset Ratio we can conclude it is very low, at 11%. This kind of ratio tells us that 11% of assets are financed through debt. It is really good for Paypal´s financial health and has plenty room of for debt financing if the company would need it.
The last of our relevant ratios is called the Financial Leverage Ratio, which´s the development you can find on the right axis. It is calculated by dividing the company’s total assets by its total equity. We can see a slight deceleration here, but the ratio at 3.5 is very solid.

Comments
Post has no comment yet.