Now we see all the important ratios for our balance sheet analysis. The best guide here is to mark the individual ratios/ rating. I suggest marking each ratio from 1 to 5, where 1 is the weakest and 5 is the strongest. You are doing the evaluating system, which is the most objective system you can do. For selected ratios, you need to set some boundaries. The good way is to compare your potentially attractive companies with each other. The best way is to compare companies in a selected industry.
For example, if we want to analyze Alibaba’s stock and company, we should look for similar companies in the chosen industry, such as JD.com, Pinduoduo, MercadoLibre, and so on. You can find it easily and we guess it will be for free in SeekingAlpha, Gurufocus, or in Finviz or Zacks. However, if not, there are many sites on the internet for sure, where you can do it for free.
Maybe you are wondering about one thing. When we recommend doing an industry analysis, why did we pick and analyse three completely different companies? First of all, we would like to show the variability among the industries and their ratios. Despite information that there are differences between industries, don’t forget that financial health does not differentiate between industries in such a manner as margins or valuations.
There are several things that are different among industries: the gross of the balance sheet matters when you are analyzing a company that operates in asset-heavy businesses (energy, miners, hard-industry), where the assets as well as liabilities are high in general. On the other hand, there are asset-light companies f.e. in the technology sector, which has significantly lower need for assets (except current assets, but it depends on business). There are many other things as cyclical or non-cyclical differences, dividend policy or buyback policy. Asset-heavy companies tend to have stronger dividend policies (+ buybacks) than technology companies (they prefer strong buybacks).
In the table above, we can see many differences in the balance sheet ratios between the analysed companies. The best way to objectify the results is by creating a rating table. Here are the results:
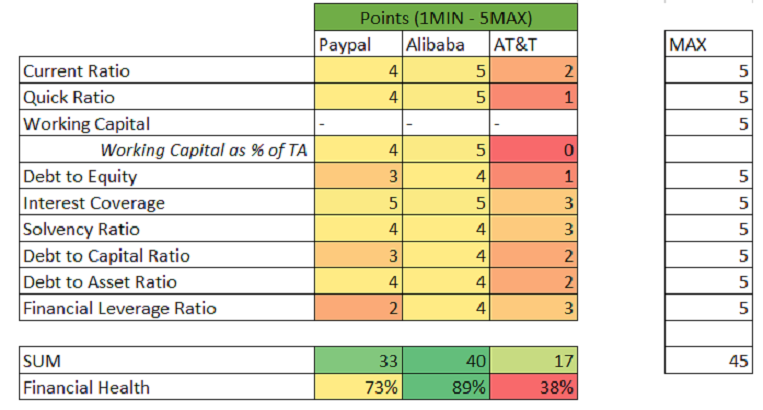
Source: Author’s calculation

Comments
Post has no comment yet.