Not just one click
The process of opening a trade consists of several important steps, which can give you a higher probability of success. Therefore, it is not just about ´one click´, but countless minutes, hours or days to analyze the market, depending on the type of a trade. One part of the analysis is technical analysis, which shows where we are with the price. In the following article we will look at this by analyzing gold.
Read more: Statistical, technical & behavioral analysis of Silver
Volume profile
Volume profile is based on statistical indicator, the Gaussian distribution, which is probability distribution, where, the peak of the curve shows the highest volume traded on that price. ´The most fair price for the market´. In other words, the green area on the chart represents 68,27% of all traded volume of the session and the yellow line, Point Of Control (POC), is the level of our interest, since it is the highest traded volume of the session, which represents support or resistance level.
From the chart below the support is set from the POC of daily volume from 29.3.2022 at price 1917.5 $/ounce. The next support area could be the higher volume area 1897.7$-1902.8$, from the same day.
Resistance is set by Thursday’s POC at 1946.5$.
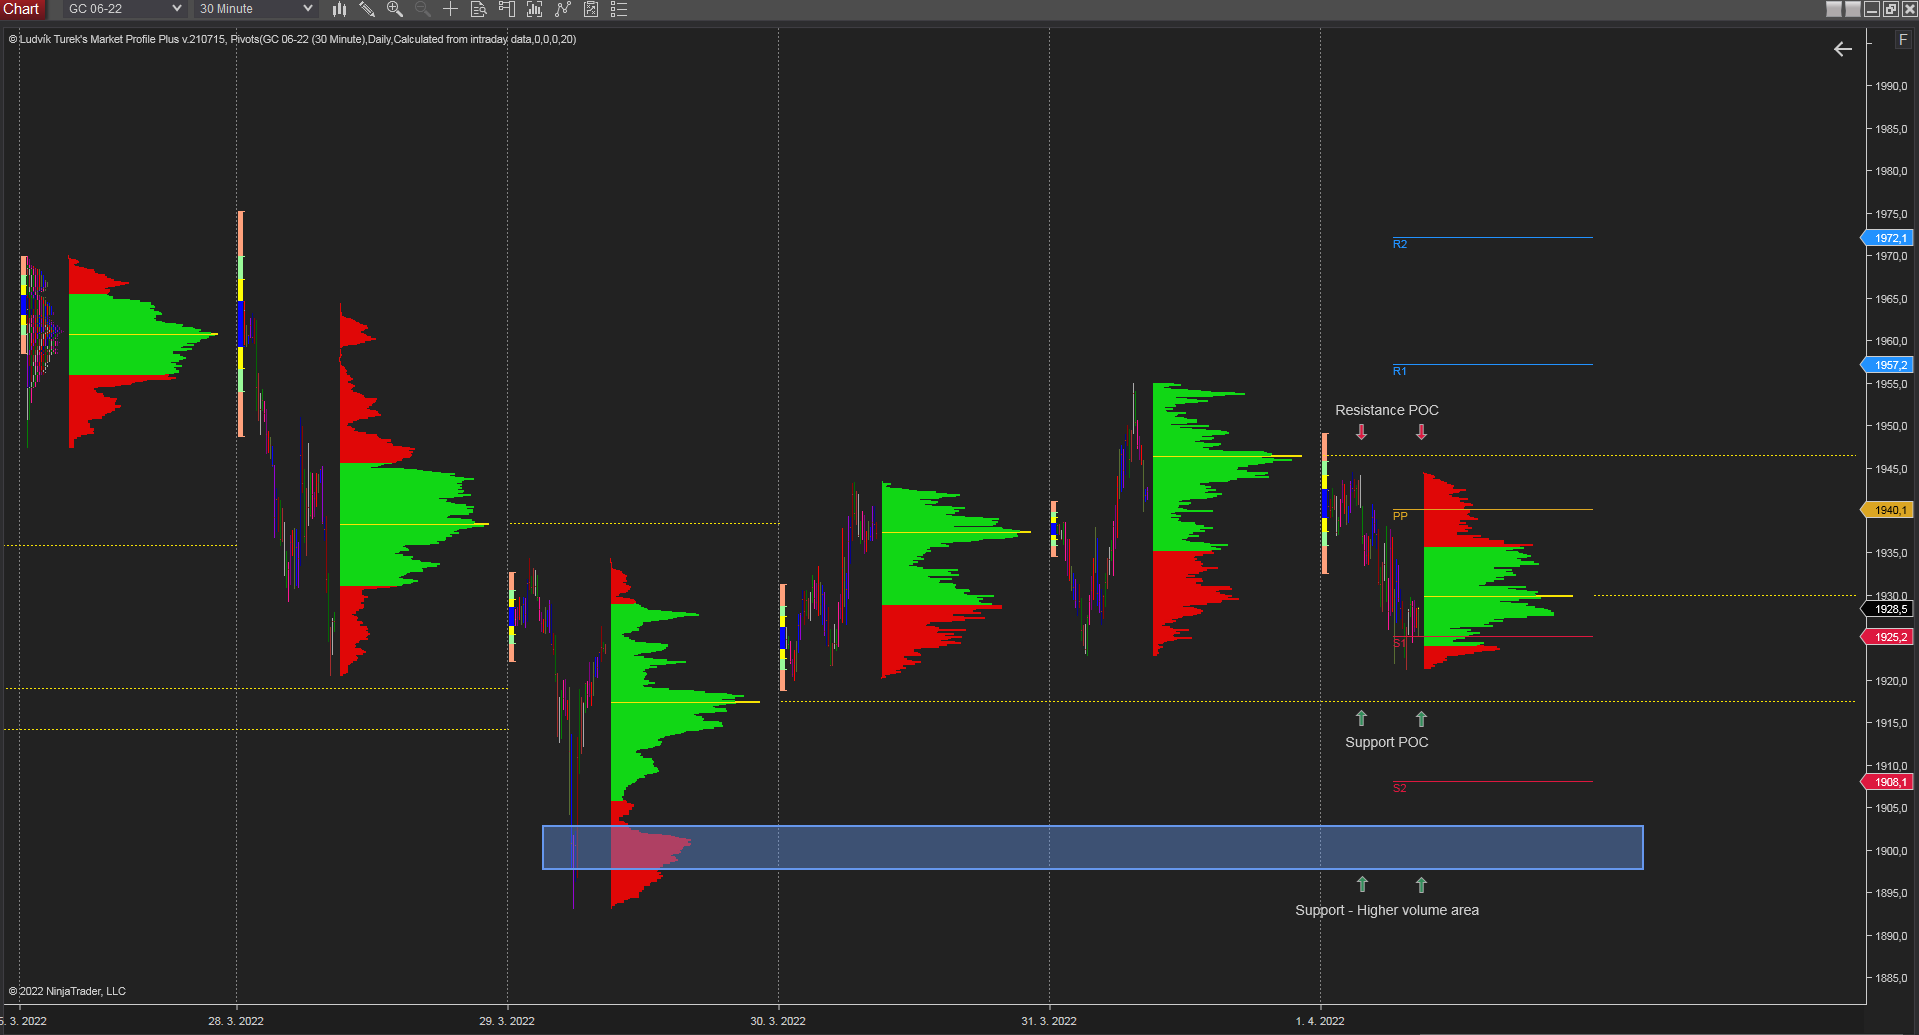
30 minutes chart of GC, Daily Market profile. Source: Author´s analysis
Weekly volume profile shows the closest support level at price 1860.7$ and resistance under the 2000$ price tag at 1996$.
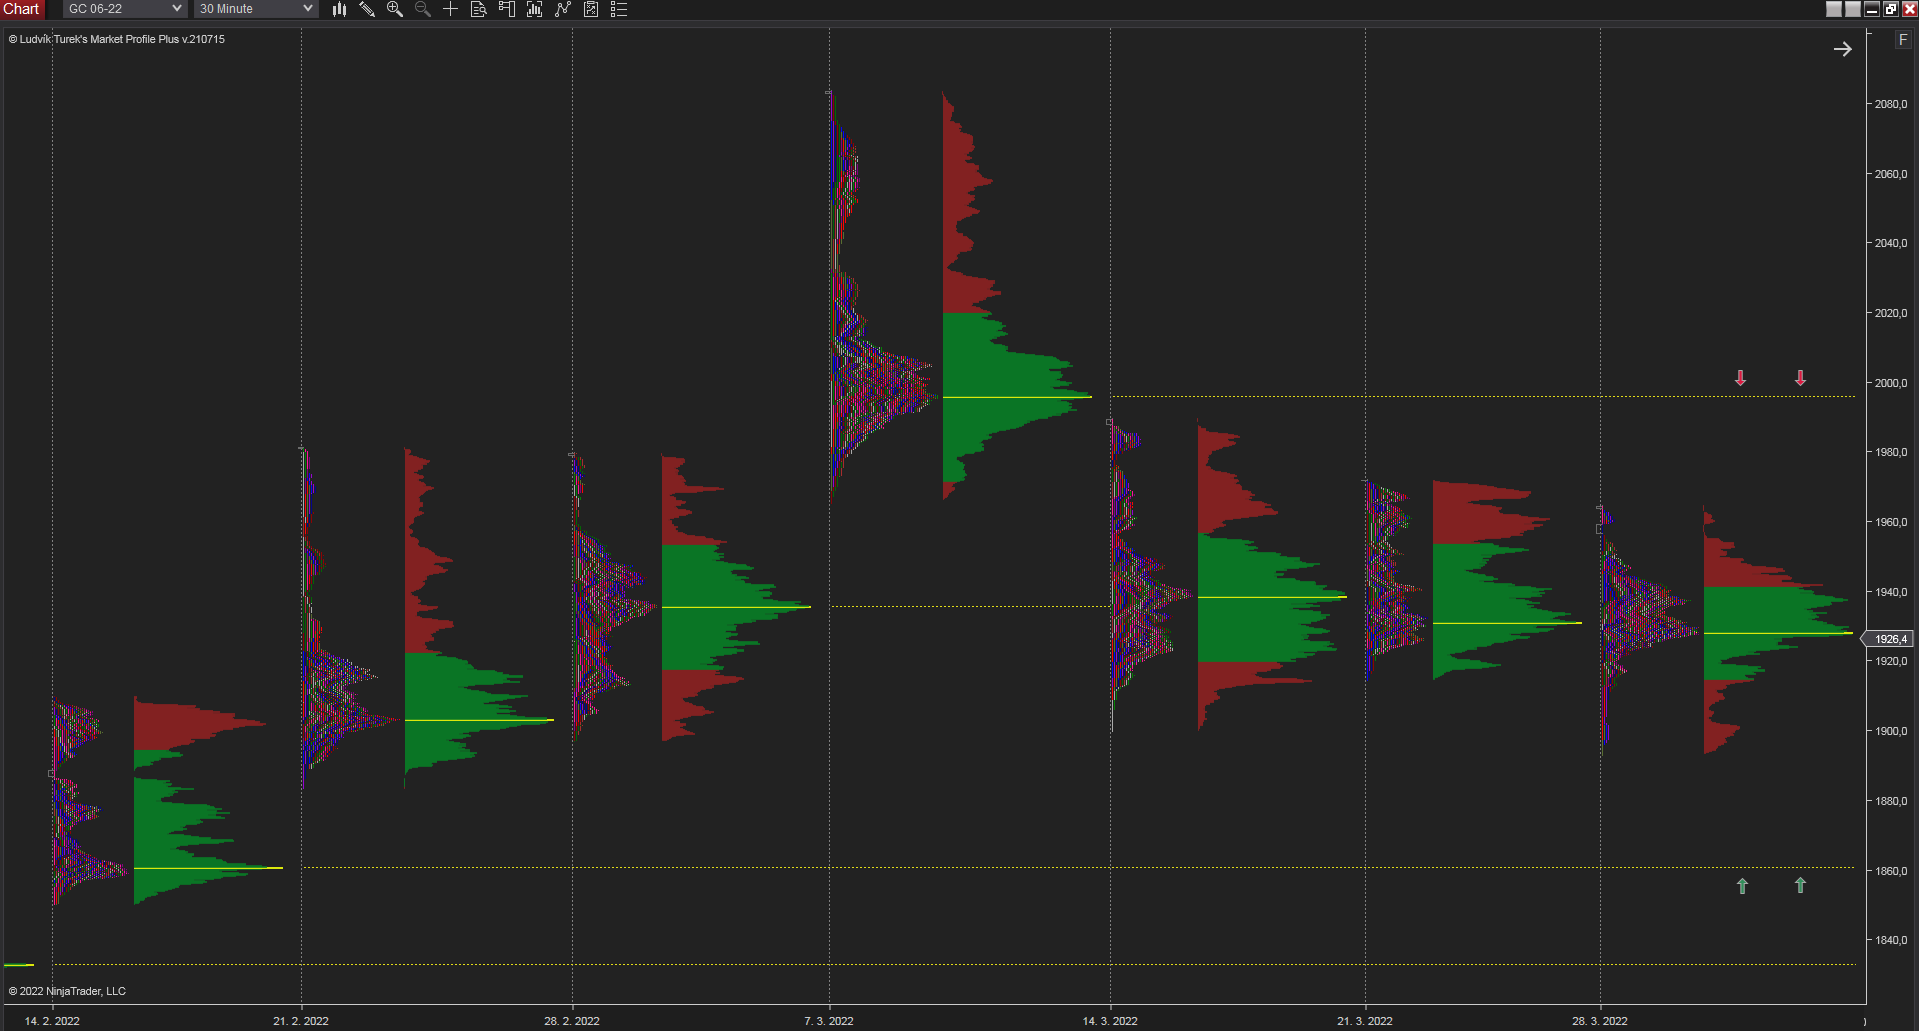
60 minutes chart of GC, Weekly Market profile. Source: Author´s analysis
VWAP
Volume weighted average price shows average price of financial asset weighted by the total trading volume for session. Monthly VWAP shows potential support levels of gold at 1926.6 and 1893.2 represented by 1st and 2nd standard deviation of March session. As it is seen on the chart, the price during last week reacted several times with moving 1st standard deviation (orange line). Moreover in current month price declined to this support level and tested it. Resistance is set by VWAP at 1964.3 (yellow line).
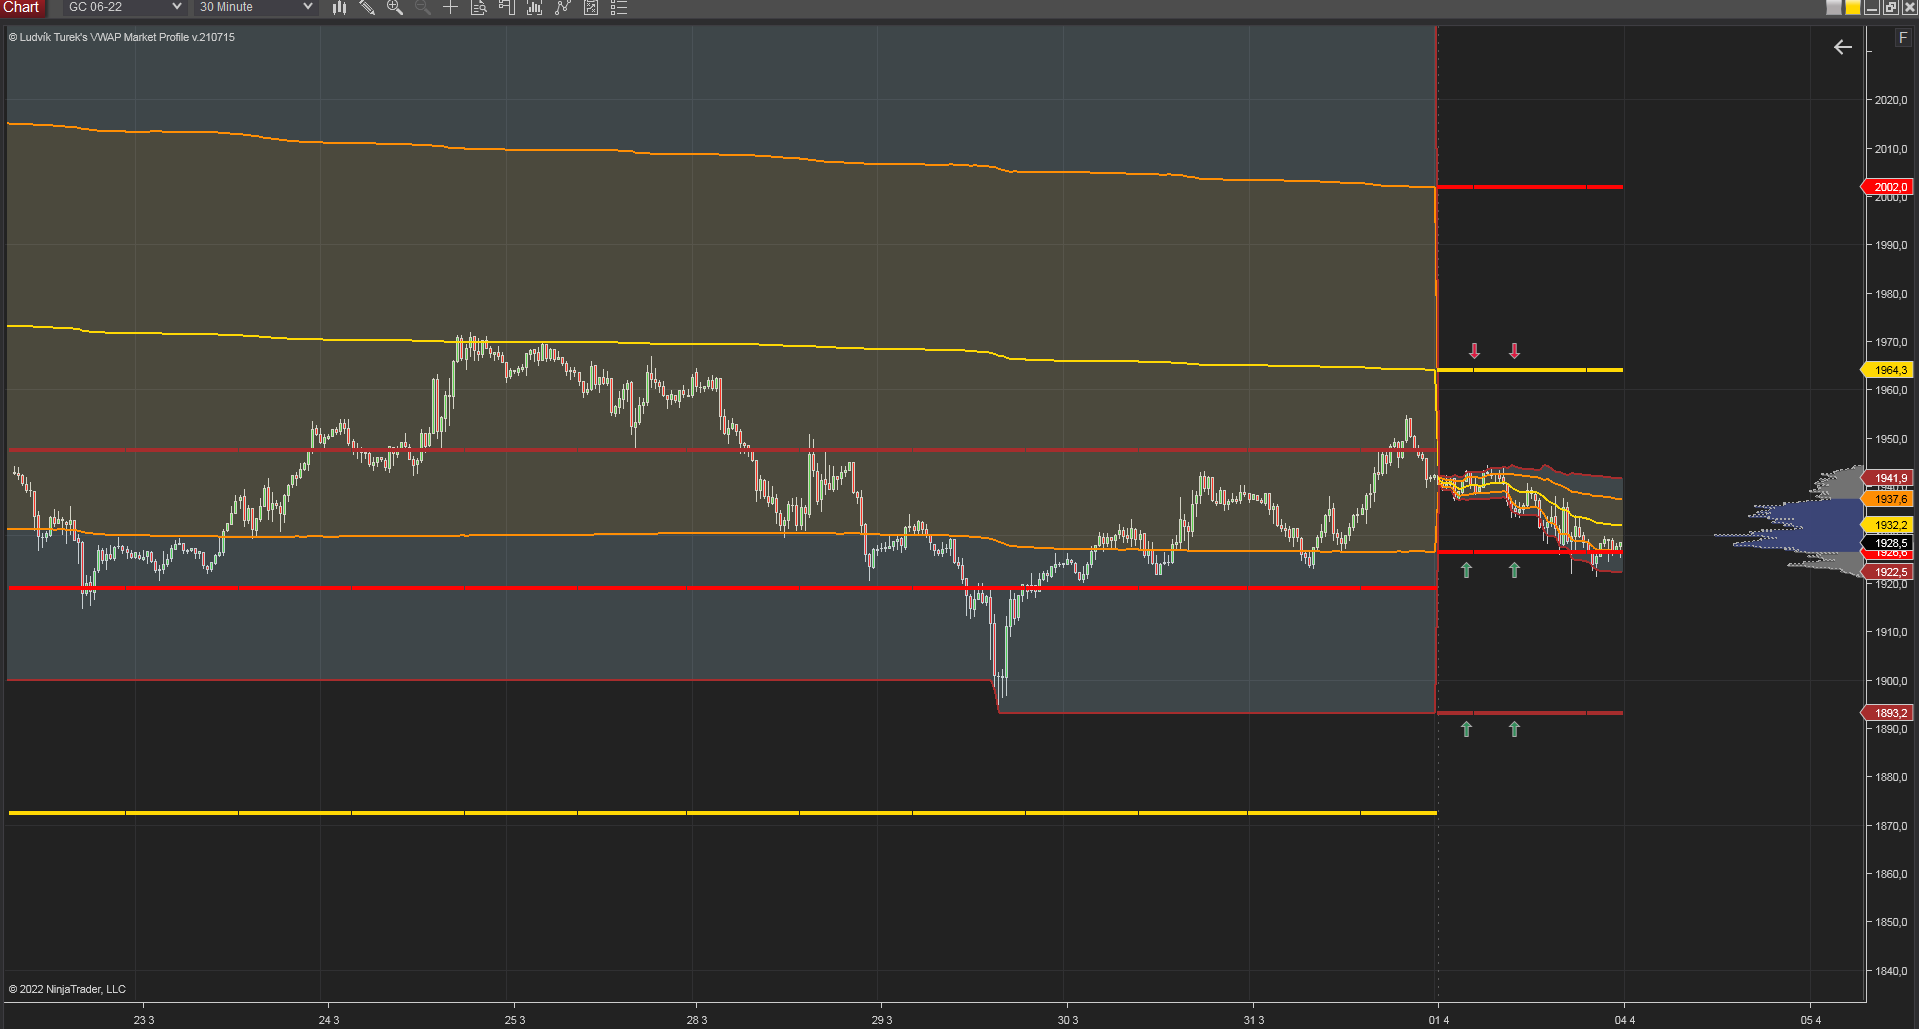
30 minutes chart of GC, Monthly VWAP. Source: Author´s analysis
Price action
From price action setups we can highlight 123 gap formation, where this formation created possible support in area 1902.3-1908.8. Resistance area lays at 1956.4-1959.5.
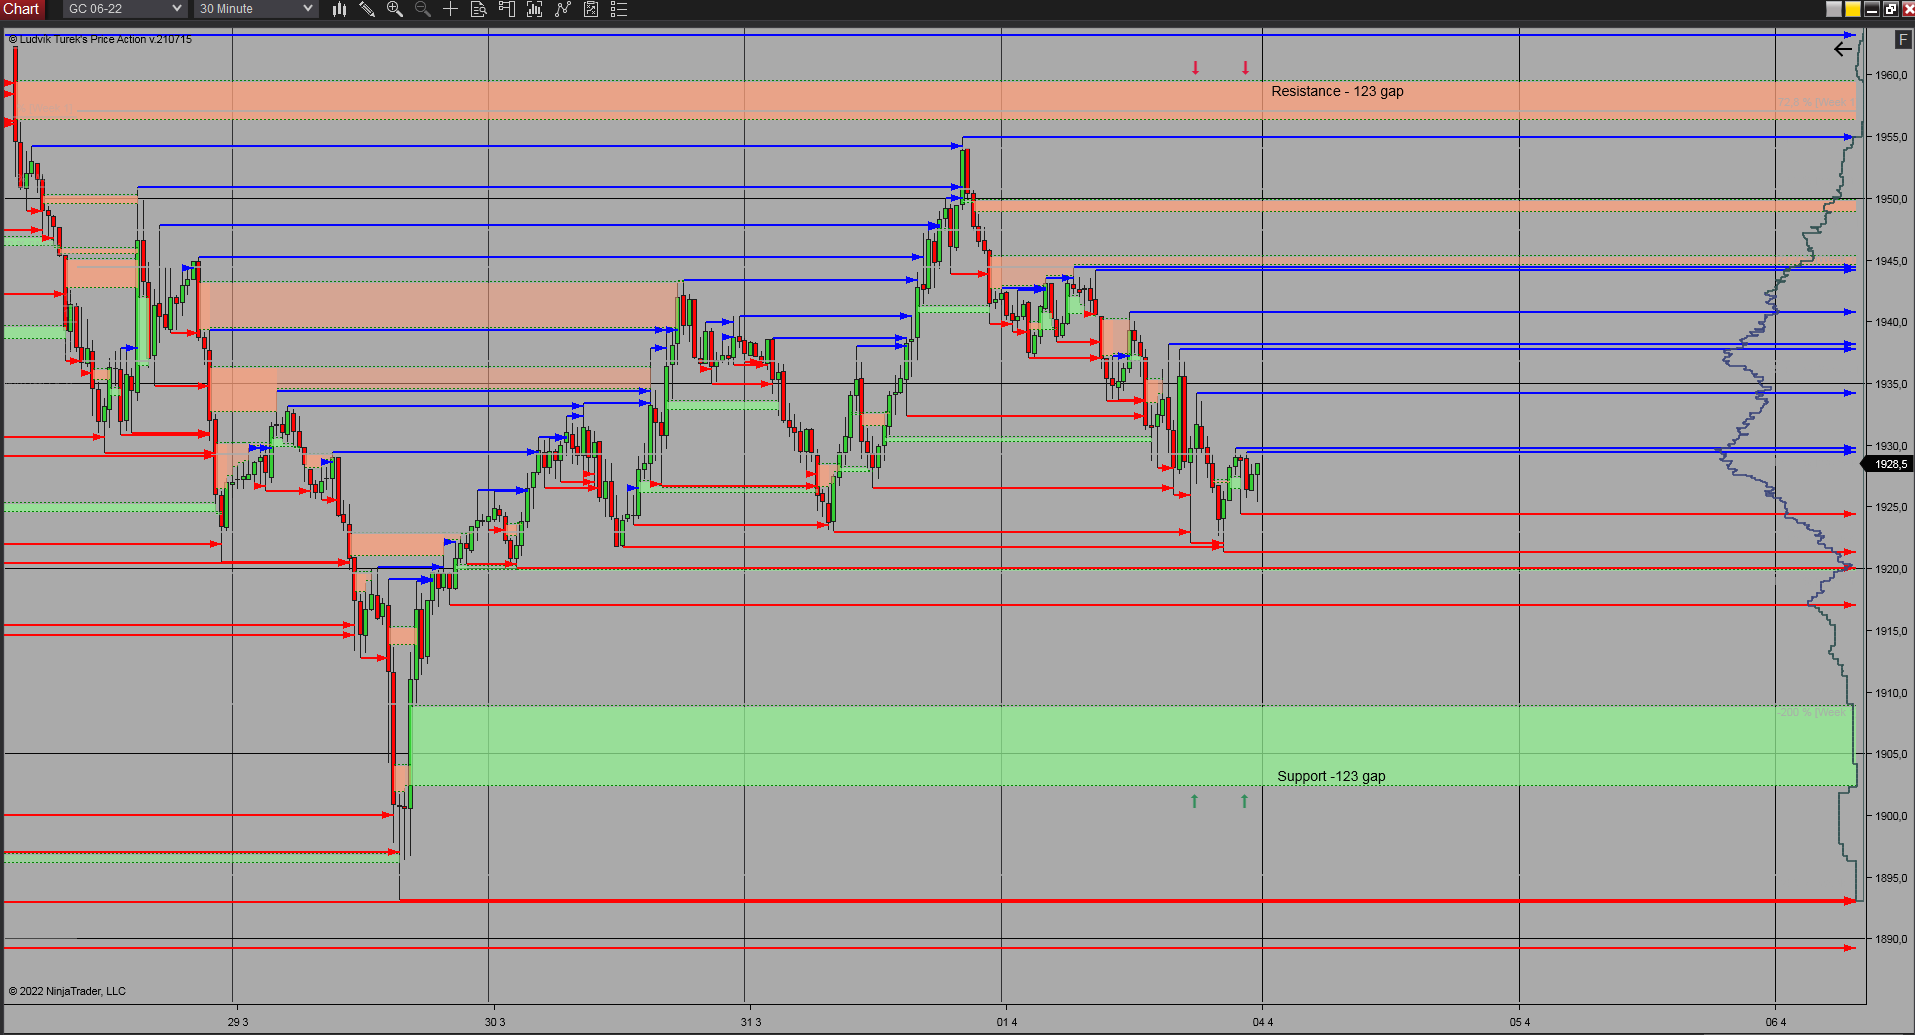
30 minutes chart of GC, Price action. Source: Author´s analysis
Conclusion
From all data above, conjunction of mentioned indicators could determine support and resistance levels or areas.
First support area is from level 1893.2 – 1908.8 which represents move 0.82%. That is the area which should be the main point of interest. In consideration of higher volatility on Gold futures from last month, where daily moves were able to reach more than 3%, area of interest is considered too wide and money management of the possible trade is needed to change. In the case this area will not hold, another support is at level 1860.7.
First resistance is set at 1946.5, but the main resistance area is range 1956.4-1964.3, which represents move 0.4%. If resistance will not hold the price, next level is at 1996, close to psychological 2000$ price tag.


Comments