Gold/stocks correlation
The end of the last week brought intense downside activity for gold futures as it erased more than 3% while continuing in a downtrend. A high correlation between gold and the stock markets causes the same direction. Negative sentiment persists in the markets, and the fight against inflation, which is not effective yet, shows disruption in the hope for the end of this bloodbath.
Related article: US dollar should stay supported in the current macro environment
The strength of the US dollar is vivid; therefore, financial assets denominated in the US dollar are losing ground. The chart below shows a high correlation between the S&P 500 index and GC (Gold Futures) in 6 month time period. Gold’s performance is -16.20%, and the index writes -18.41%.
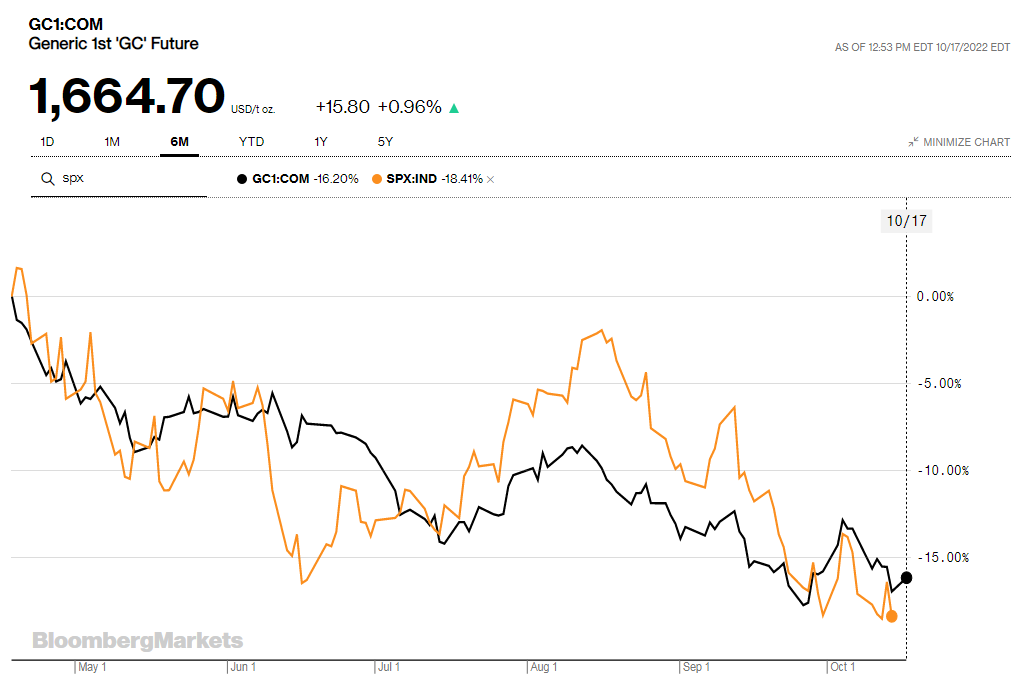
6-month chart of GC (gold futures) and SP500 correlation. Source: bloomberg.com
Suspicious activity on futures volume
Despite the fact that yellow metal is going down, suspicious activity can be seen on the futures volume. Delta volume, which is the difference between the number of asks and bids, shows several significant up-ticks. Moreover, the first activity happened after the revelation of inflation data in the USA. The second activity came on the last day of the previous week, and the third uptick occurred yesterday.
Also read: Inflation – What it is and why should everyone pay attention
Those activities are highlighted in the white ellipses. Additionally, the cumulative delta rises as well. There is no decline (highlighted by the blue line) in this volume indicator from the time of the inflation revelation.
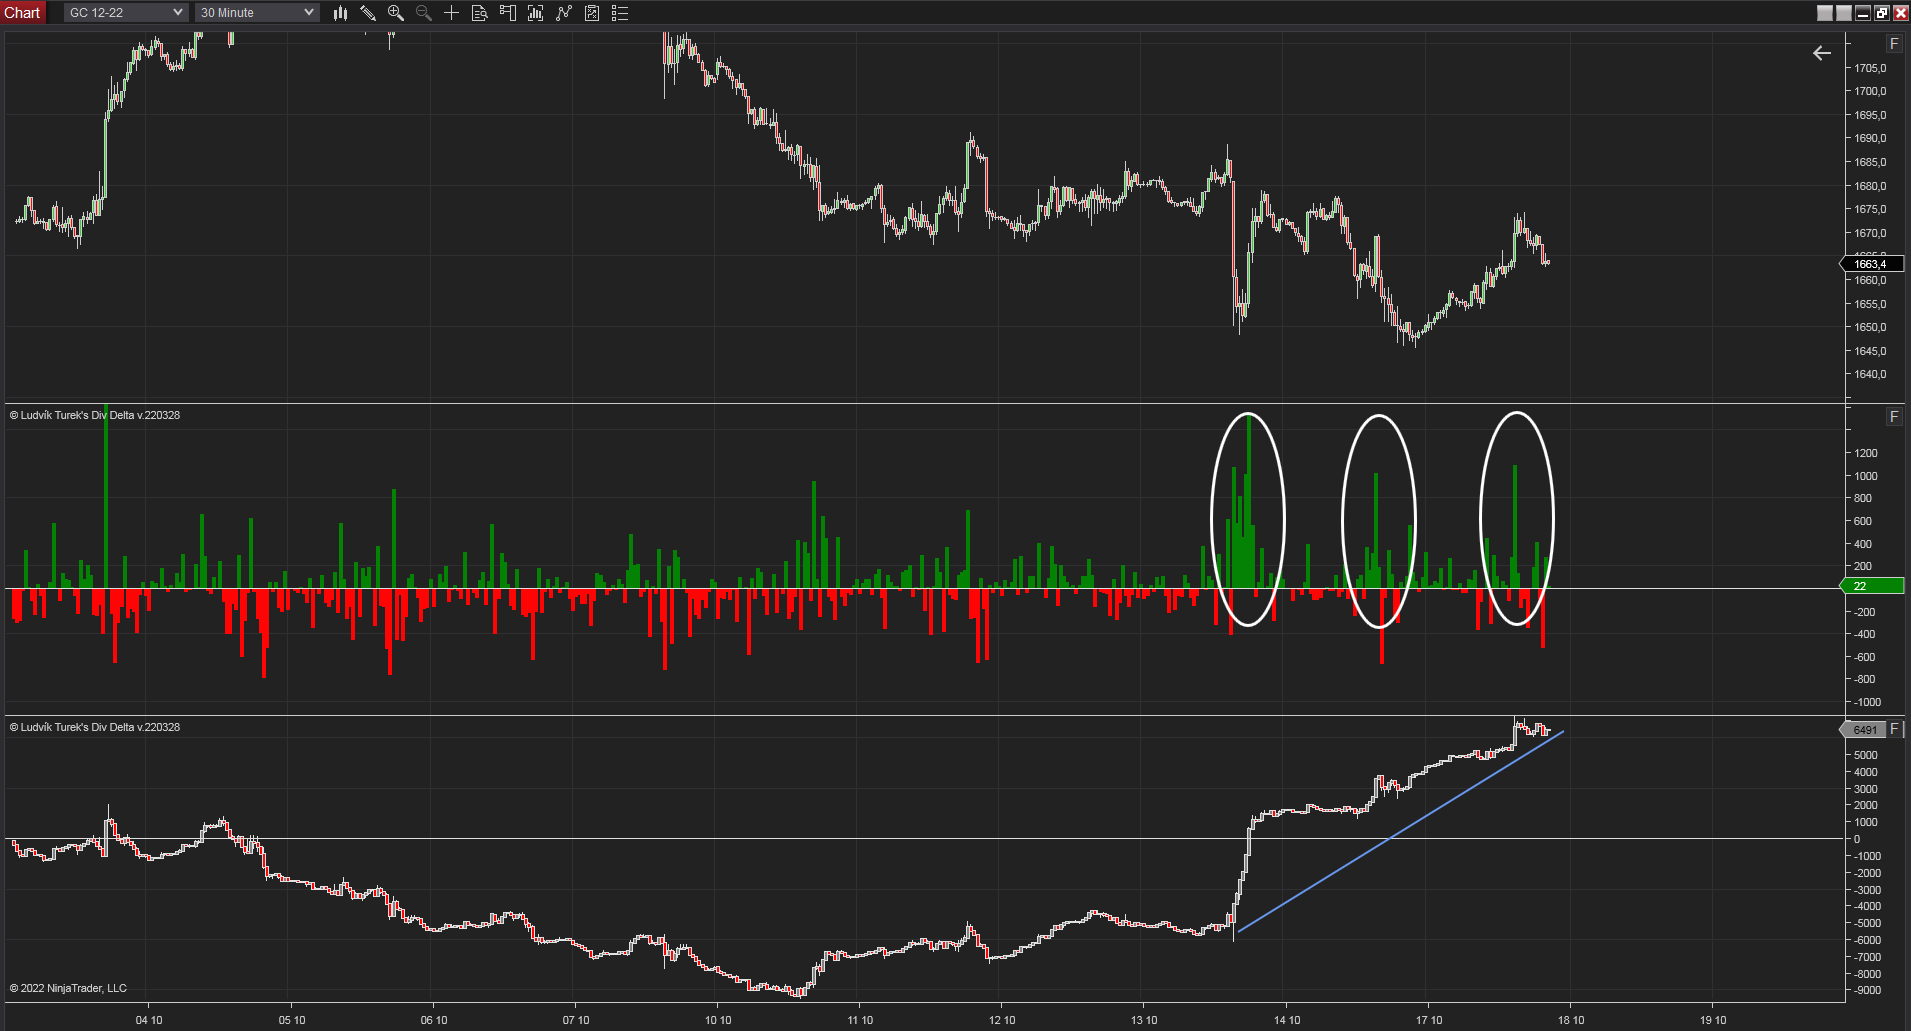
30 minutes chart of GC (Gold Futures), Divergence of the cumulative delta. Source: Author’s analysis
Is this the end of the downtrend?
Maybe we all want to be at the end of this downtrend. But the answer so far seems to be no. We can not try to find the bottom. Finding the tops and bottom is the first big mistake in trading. But this picture shows that the ASK side is alive and is able to find the volume to fight back.
Moreover, this activity is suspicious and very interesting. Definitely, it is good not to forget the area from $1650 to $1680 for future price moves because this price range will be good support/resistance. Negative fundaments persist while gold is still in the downtrend. Do not forget that trend is your friend.


Comments
Post has no comment yet.