While central bankers claim “we are not in a recession,” some experts claim the opposite. The US Dollar is getting stronger than ever as EUR/USD dives below parity once again. There are massive price increases in commodities, especially gas in Europe. Germany was forced to lower VAT on natural gas as a result. All these events are probably just preparation for what is about to come.
Audio version:
Another selloff in the making?
While there was a relief rally in the summer, many technical aspects point to a continuation of a started downtrend. Nasdaq bounced from the moving average (EMA200) in June and rallied from 11,000 to 13,500 upward to the descending channel. A massive bearish divergence confirmed the idea of a possible downturn, and stock markets continued to slide as Nasdaq fell by about 2.2% on Monday, August 22.
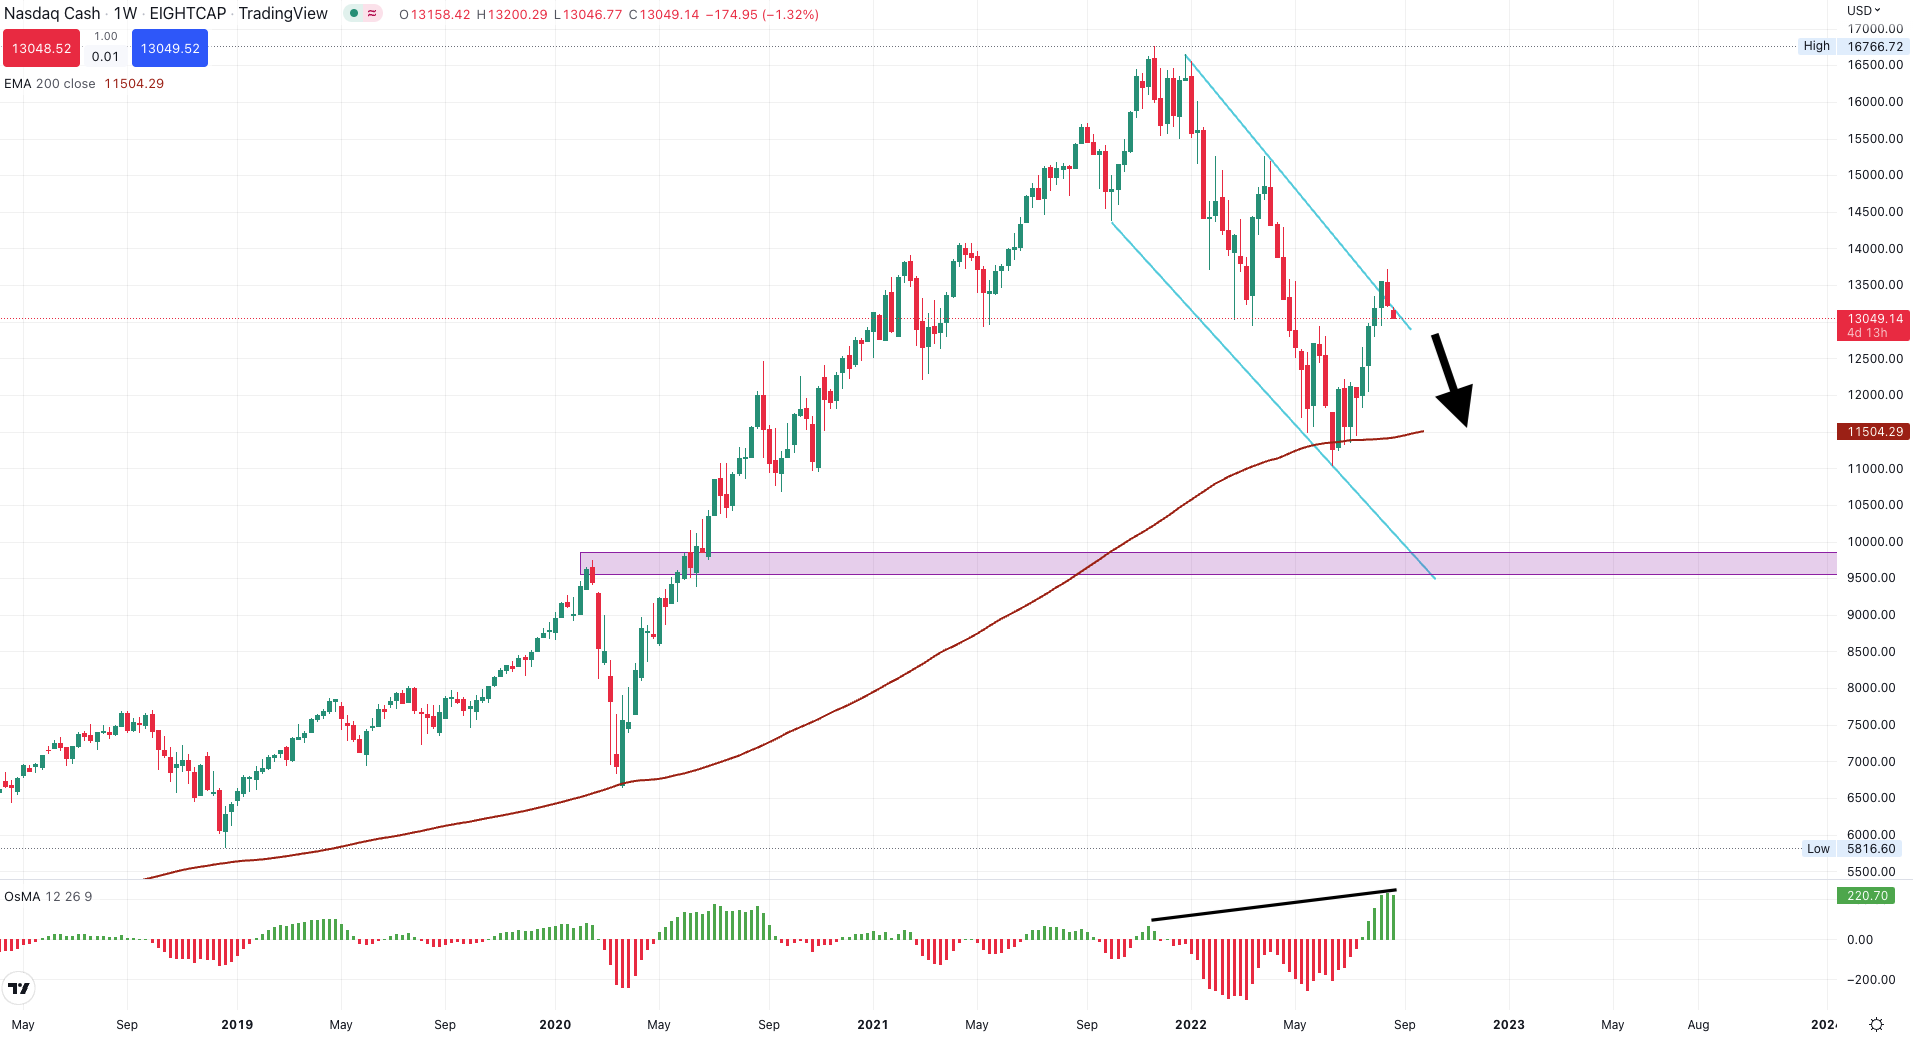
NASDAQ weekly chart, source: tradingview.com
When you look at Nasdaq from a daily timeframe, there is a clean bounce from the blue trend line and a break of the black trend line, suggesting it might just be a temporary peak. The market also failed to break the moving average and significantly overbought indicator OsMA supports the idea of another move downward.
Related blog: Bed Bath & Beyond frenzy explained
Even this survey claims a surprising 84% of people think it will take two years or longer for Jerome Powell, the chairman of the Fed, to bring the inflation down, and markets could continue to slide even more. All these pessimistic sentiments highlight how deeply skeptical investors are, and another selloff is very likely.
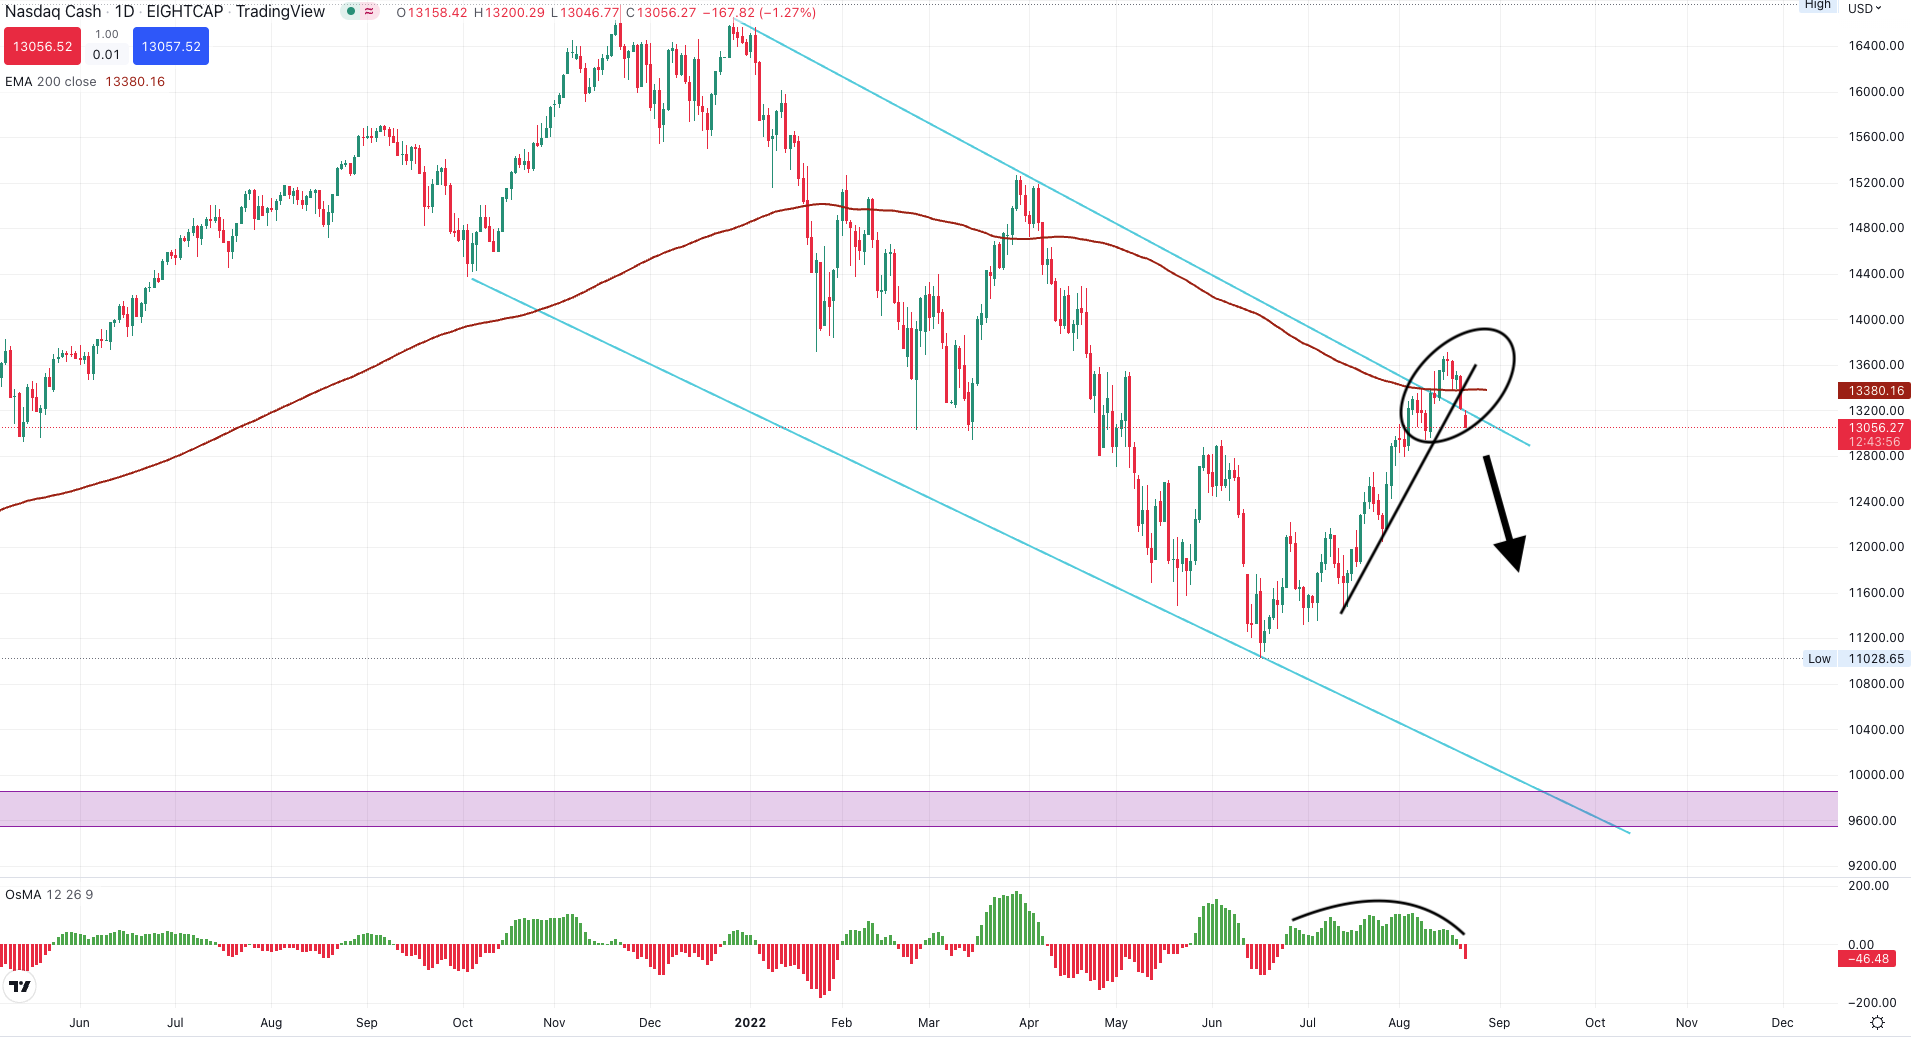
NASDAQ daily chart, source: tradingview.com
DAX looks bearish too
One of the easiest ways to identify a trend is by looking at higher or lower lows and highs. Since 2022, DAX (GER30) made several lower highs but always stopped at the support of 12,394. The last bounce downward showed as strong as the market refused to rise above EMA200. Now the market refused to break the trend line, and bearish divergences confirmed the reversal is here.
You can also read: Gazprom will shut down Nord Stream 1 again
So now there is a massive triangle formation, and usually, a new low is necessary to finish this pattern. If the bearish sentiment and bearish technical signals continue to pop up, a continuation of the bear market is very probable, possibly taking the price of DAX below 12,000 or even lower.
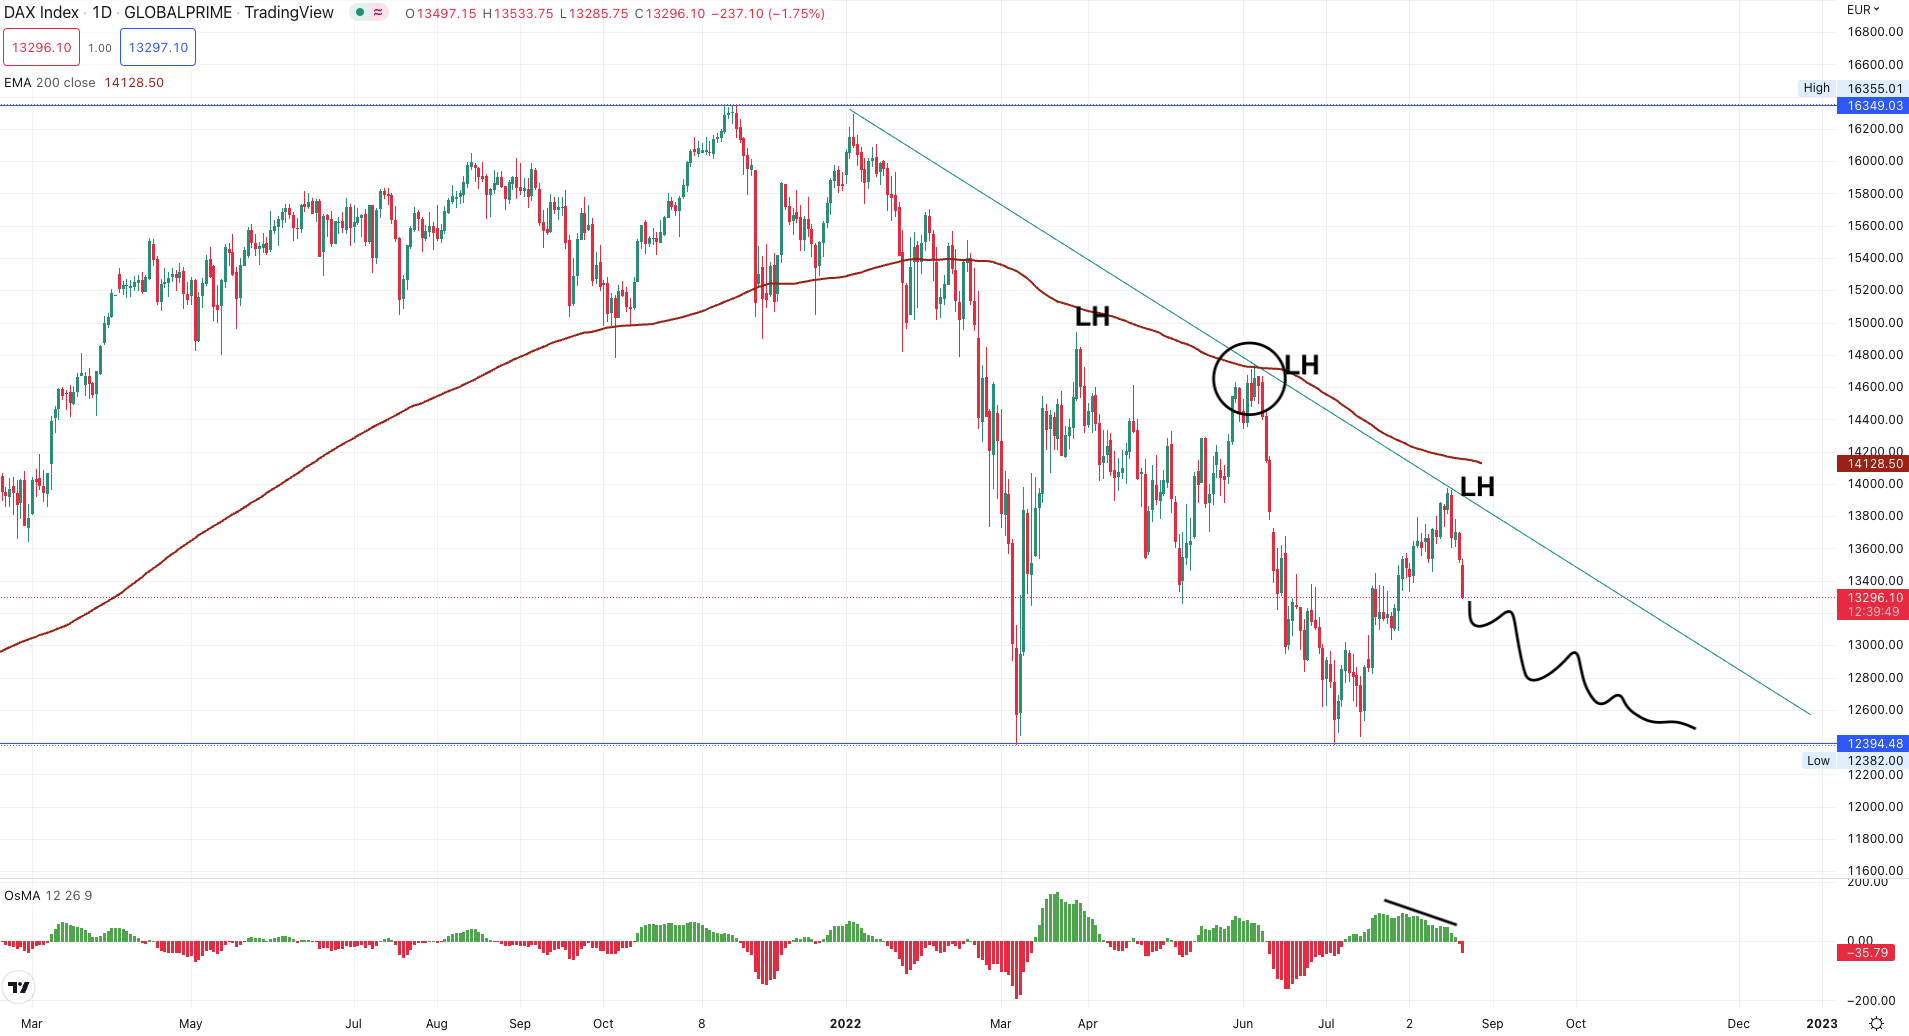
DAX daily chart, source: tradingview.com
The bottom line
Moreover, analysts expect Federal Reserve and the European Central Bank to raise interest rates even more, which could cause another selloff wave on the stock market.
So many signals confirm another market decline in the upcoming months, and its probability is very high. However, do not let this article influence you if you are a long-term investor, as this is a short-term perspective on markets, with a timeframe of 6-12 months.


Comments
Post has no comment yet.