Due to concerns about a recession, we continued to be long on bonds with long maturities in our most recent macro analysis. If nothing drastically changes, we will continue to be optimistic on these bonds (with long-term maturities) over the next 0–6 months. We revealed this set-up 2-3 weeks ago near the peak in yields, thus still having some profits. For the DAX, we also found a bullish setup. The thesis did make sense. Our thesis was based on our probability model, which predicted that after 5 weeks of continuous fall, the 6th week will be positive. The DAX traded negatively for 5 consecutive weeks.
Read our macro report from the previous week: Weekly macro report – Bonds reached some gains
That’s exactly what happened; a partial take profit was possible, but the stop loss was hit because there was high volatility early in the week related to weak fundamentals. The total risk-reward setup was safeguarded by our stop loss, because the downturn was substantially more severe. However, the powerful bullish surge entered in the last two days, and the gaps (prior targets) were filled. The likelihood that the sixth consecutive week to be bullish was just over 90%, but we chose to take a highly cautious stance because risk aversion and market volatility are rising sharply. The problem was that we were right, but due to significantly increased volatility, our SL has been hit. Never mind, the SL was very conservative, but protected the capital from further decreasing as a drawdown for the 6th week would be huge.
MarketWatch – What happened the last week
This is how the market closed in the last week:

Market development in the previous week, Source: Investro Analytics Team
There have been some major events, which have impacted the stock market and bond market development in the previous week. We are talking about the job report from June in the USA, as well as ISM new orders and FOMC Minutes.
Job figures and implications on rates and yields
The unemployment rate in June remained at 3.6% (consensus 3.6%), the same as in the previous month. Nonfarm payrolls rose 372k vs. 384k in the previous month, but strongly and positively surpassed consensus at 268k. Average hourly earnings (AHE) rose 0.3% MoM or 5.1% in YoY. As we stated in FOMC Minutes, these are quite important data for the Fed, showing currently a strong labor market showing no signs of recession in labor market. However, bear in mind, that the labor market is significantly lagging. AHE is a problem for the Fed, because, there are wage pressures that could lead to higher inflation pressures.
The result from the job report is inflationary, as there were no signs of such a big economic slowdown and represents a solid labor market for now. However, the average hours for weeks slightly decreased and may indicate that companies started to prefer part-timers due to uncertain outlook.
Short-term yields rose and prepared for further hikes after the job report
The stock reacted quite positively, however, bond yields surged as the market traded the narrative that the economy is strong and can handle more rate hikes. The short-term yield curve had been mainly impacted. The long-term yield curve was impacted only partially. The yield curve is inverted as the market has doubt about future growth and does not believe the Fed to deliver such hikes as revealed at the June FOMC meeting (dot plot).

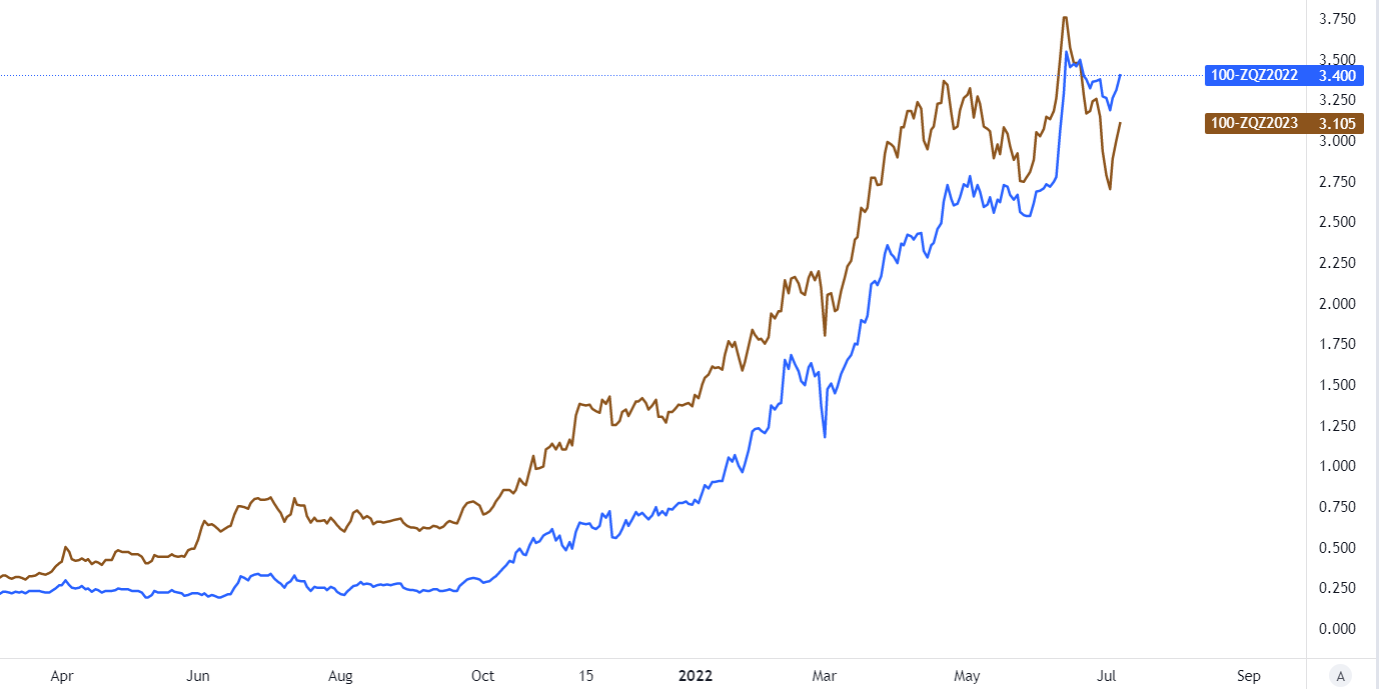
Market rates expectation after job report, Source: Tradingview
Fed funds rate futures indicate that market priced in more rate hikes after Friday´s job report. The market expects the rate to be at 3.4% in Dec 2022 and 3.1% in Dec 2023 (more than the Fed reported in the June meeting), thus pricing rate cuts in 2023 due to recession fears and economic slowdown. The spread between Dec 2023 and Dec 2022 market expectations is -0.295 bps, thus indicating that market actually prices in rate cuts in 2023.
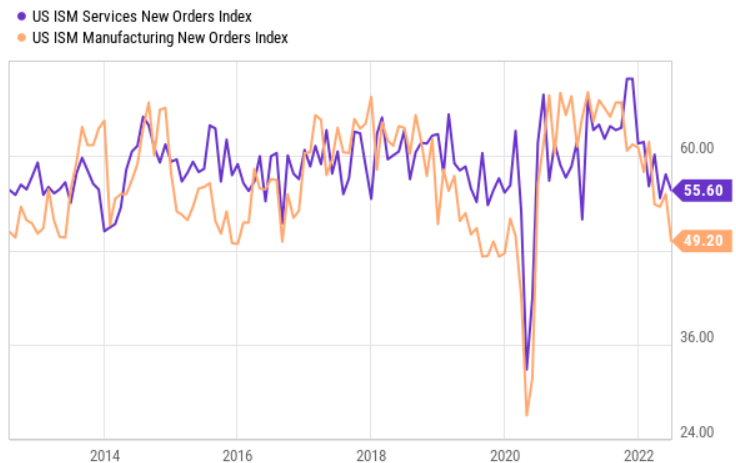
ISM New Orders continue to decline in June
As we stated in our previous reports, the commodity prices have already declined. It is the first indicator of economic slowdown. The next is consumer spending destruction and the most actual are ISM Services New orders and inventories. ISM Manufacturing New Orders are the 2019 and 2016 and 2014 low areas, while services are slightly better. But the slowdown can be monitored. However, services are still bullish.
Read also: Market outlook: Bitcoin, Oil WTI and DAX

US ISM Services and Manufacturing New Orders Indexes, Source: Ychart via SeekingAlpha
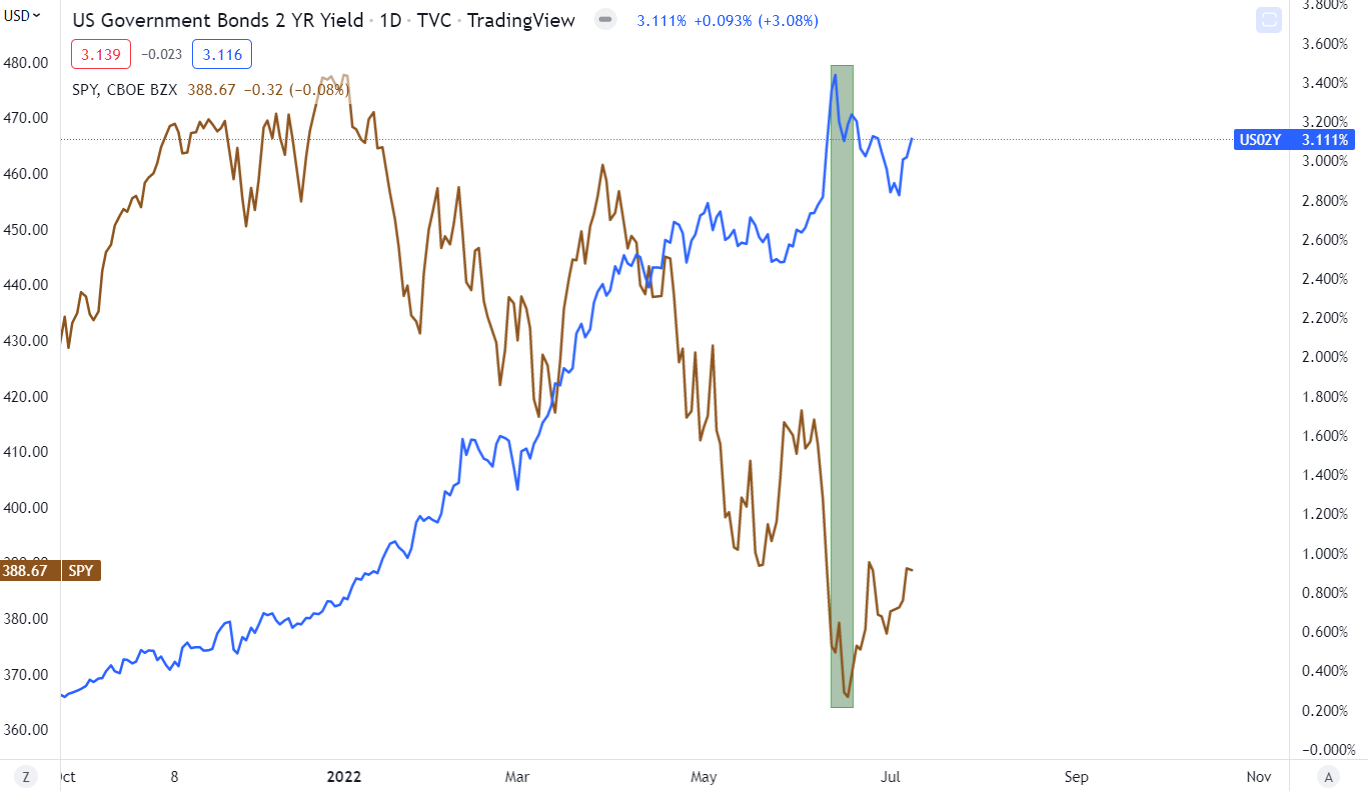
S&P 500 and short-term yields peak
The peak in the front-end yield curve, taking into account US02 yields, was 3.43%. The next decrease also helped the S&P 500 short-term market rally, approximately 5% from lows. However, we do not know how the short-term yield curve will develop, but there are strong narrative that 3.3% – 3.6% could be a medium-term market peak if inflation won´t negatively surprise everyone in July and August.

US02Y and SPY (S&P 500), Source: Tradingview
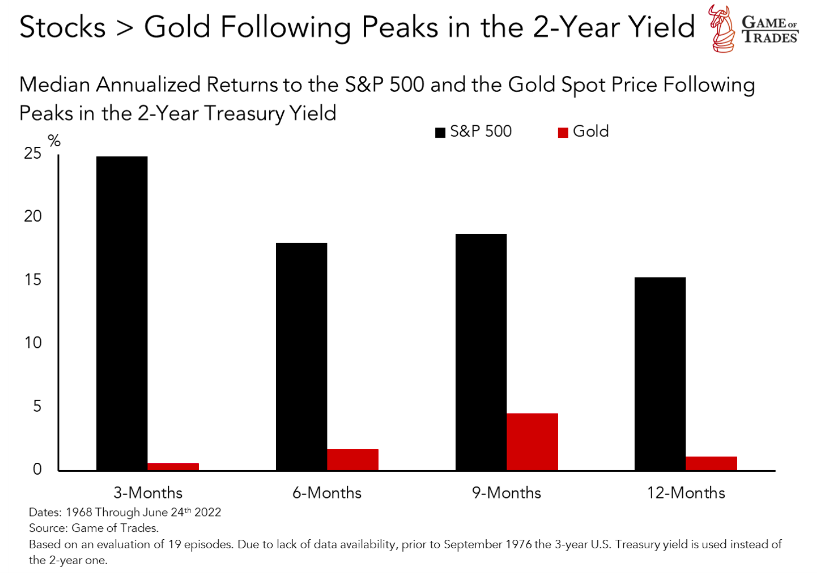
Great research from the Game of Trades guys revealed stock and gold average performance after peaks in 2-year yields. While short-term results suggest that there is room for a mid-term bullish rally in stocks (S&P 500), the gold performance is bad. However, in terms of market turmoil or unexpected corrections, bond yields and stock prices are highly correlated. The numbers can be right when we looked at the fresh historical dataset. However, there can also be big drawdowns as markets can be volatile. The strong exceptions (do not confirm the thesis) were the 2000 dot-com bubble and the 2018 short-term drawdown (as the Fed flip-flopped on monetary policy). But most of the time, the results are very great from a historical perspective.

Stock over Gold performance after peaks in the 2-Year yield, Source: Game of Trades
As we stated, we do not know if we hit the market peak in the short-term yield curve. We believe so. However, a potential for bad core inflation results in June with a strong labor market could influence the Fed to deliver more hikes. Current market expectations are for 50–75 bps rate hikes in July. According to FOMC minutes, the Fed is aware of the growth slowdown but needs to see the inflation rate decelerate to adjust its monetary policy. However, the strategy to be long in S&P 500 makes sense, but we will rather wait for inflation data for June, where the signals are mixed. We are strongly convinced that inflation can slow down not in June, but in July or August. In June, we got so many mixed signals. After June´s inflation report, we will have a clearer view.


Comments
Post has no comment yet.