Major stock indices soared roughly 2% on Wednesday as investors reacted to better results than expected. The annual inflation rate in the US slowed down to 8.5% in July of 2022 from an over 40-year high of 9.1% in June amid a significant drop in gasoline prices.
This was the first inflation drop since April this year. Signs that inflation could be peaking followed a better-than-expected employment report last week, easing concerns about an imminent recession in the world’s largest economy.
Related: Crude oil seeing the biggest drop since April
Is the selloff over?
Major US stock indices are now down by about 20% from their all-time high (ATH) levels from November 2021, a little up from minus 33% in May. As the inflation rate drops for the first time in a while, many investors are getting optimistic about assets like stocks or cryptocurrencies.
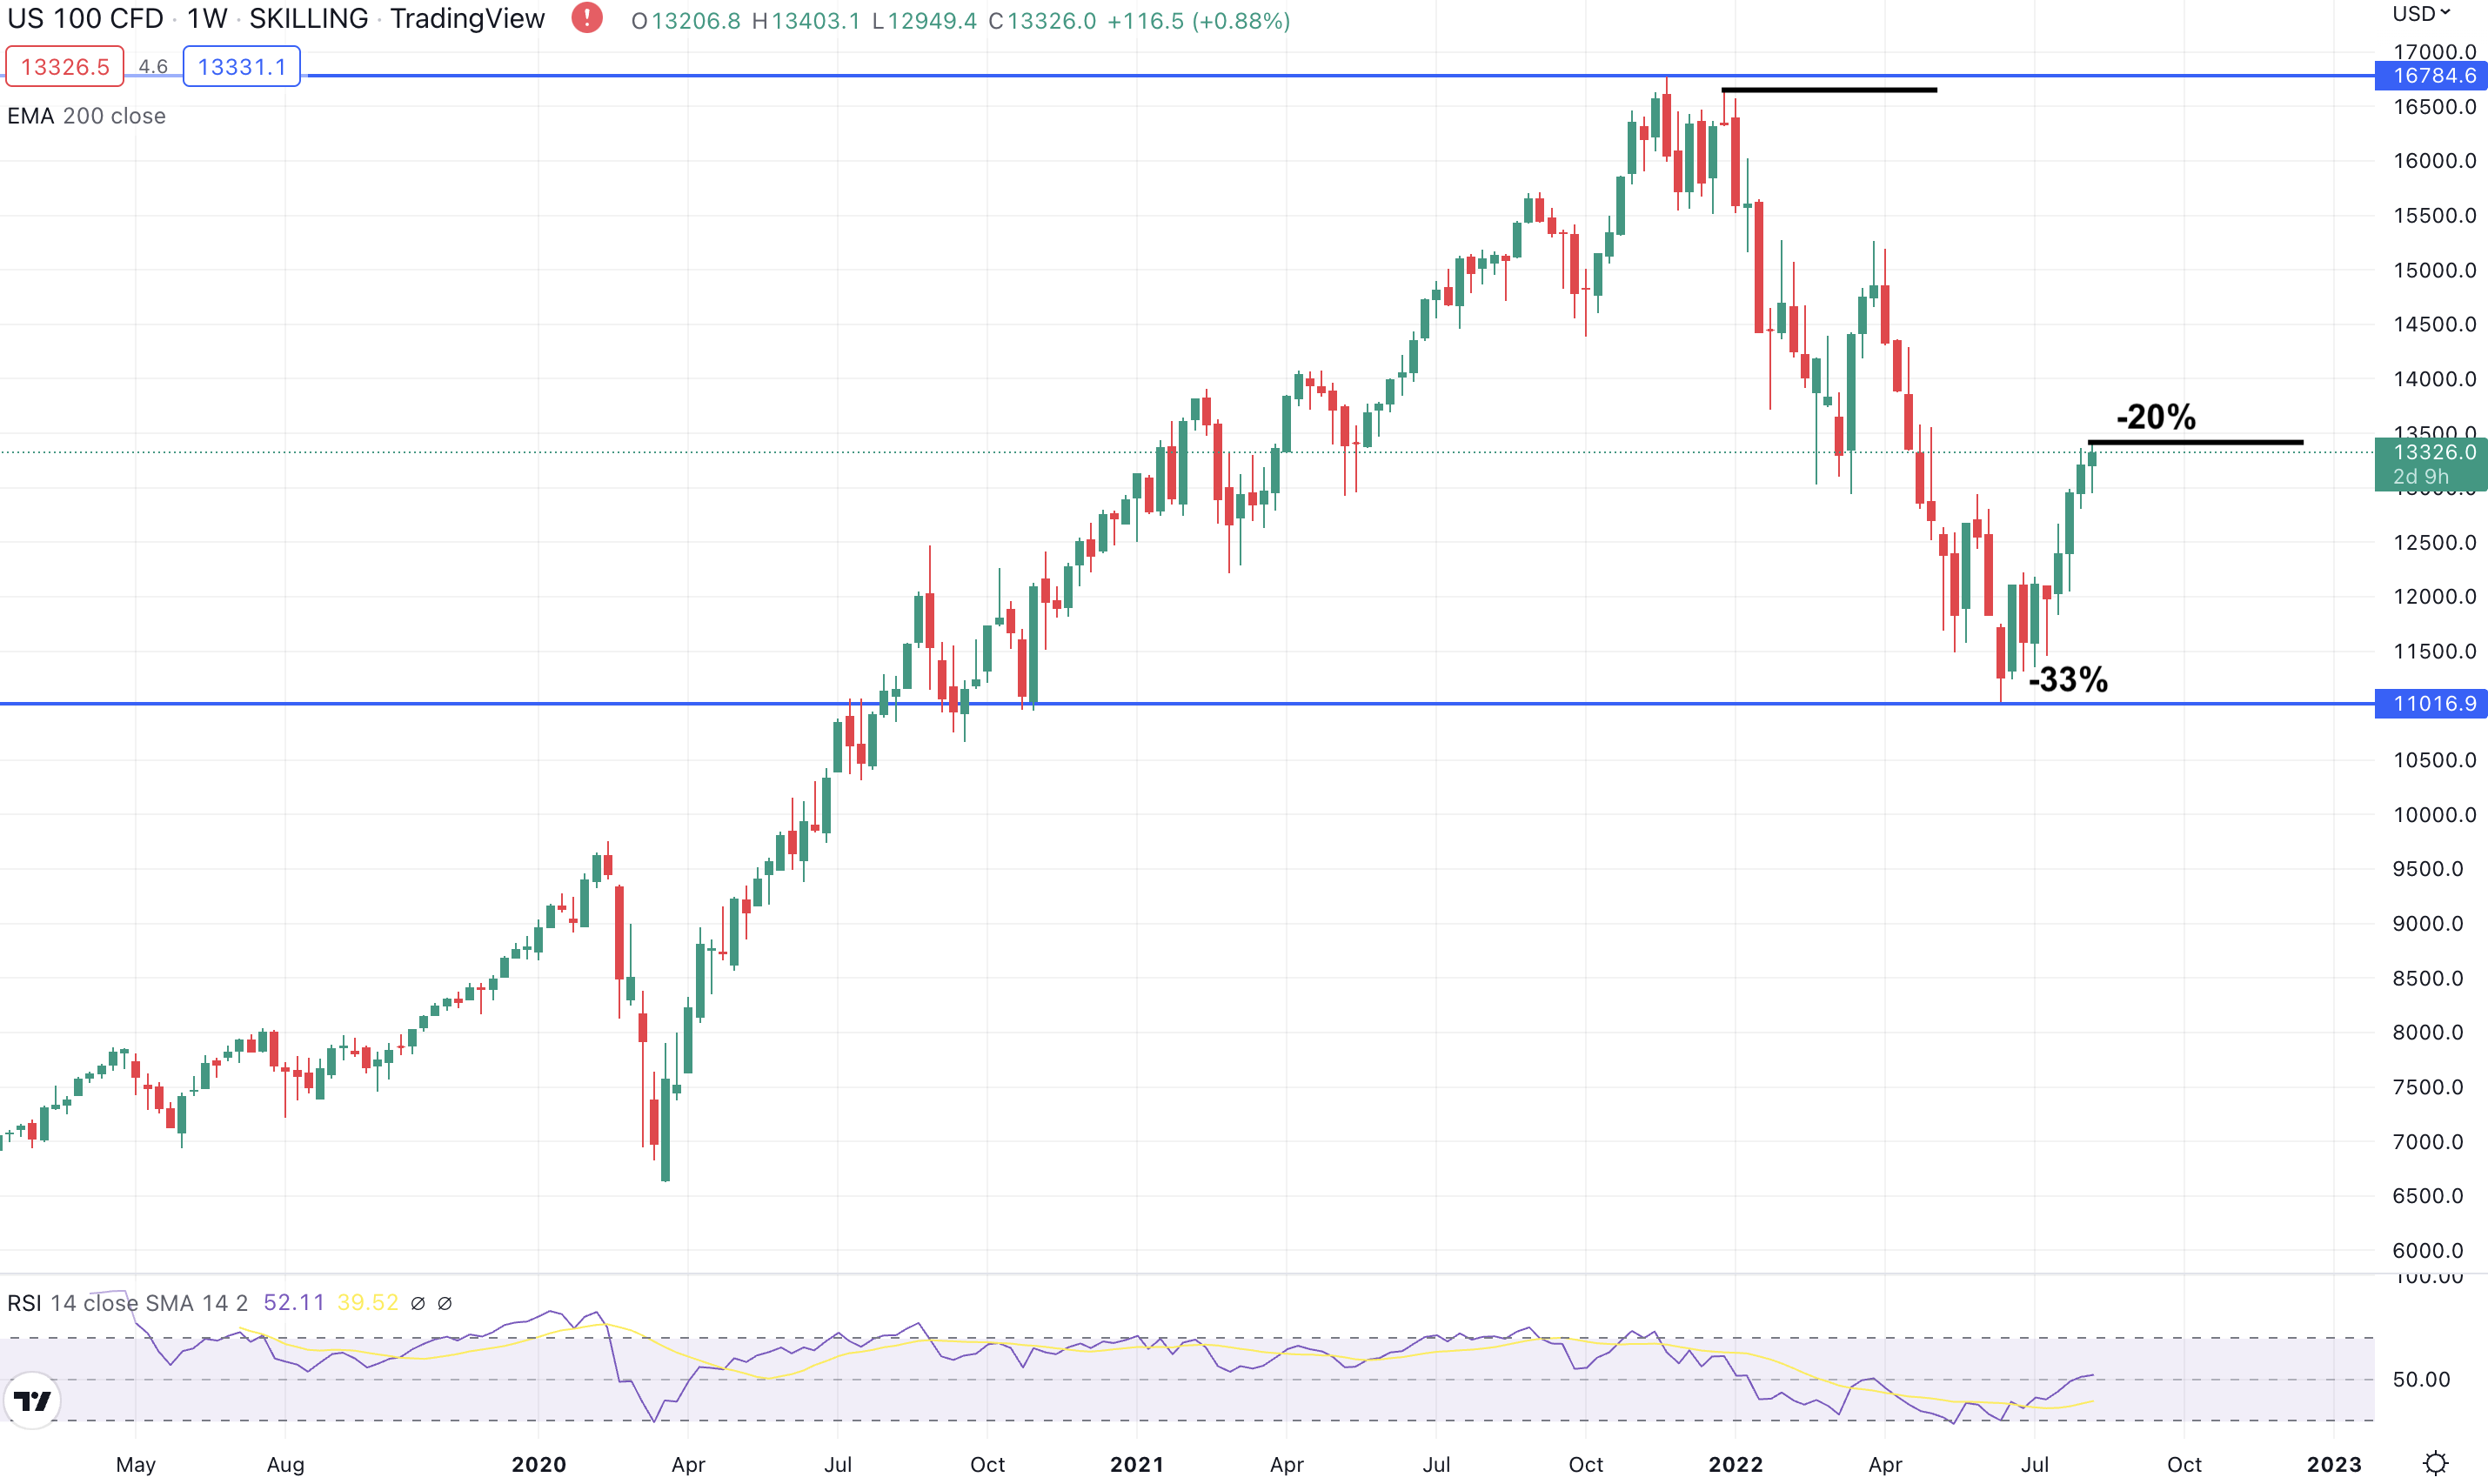
Nasdaq weekly chart, source: tradingview.com
Commodities such as WTI crude oil are down by 31% from their peak, and other commodities like copper, silver, or natural gas slowly follow. While investors celebrate great news, interest rates in the US are still at 2.5%, and Fed will probably keep a hawkish policy until inflation is back at healthy levels of 2% or 3%.
You may also read: Crypto outlook: Ethereum, Litecoin, and Algorand
Technical analysis
When Nasdaq found its peak in November 2021, it fell to 13,000. Then there was a pullback to the upside, but it stopped at the 50% level of Fibonacci in that first selloff. Nasdaq went below 13,000 to 11,000 afterward, and then another pullback upwards came. There is a very similar situation in the market right now as the one at the beginning of April.
Nasdaq returned to the moving average (EMA200) and Fibonacci, and then it went down again. Now the market is at the Fibonacci level of 50%, where there is a moving average as well. Moreover, there is a trend line that Nasdaq does not have to break. Markets are at crossroads, and the next direction will be decided very soon.
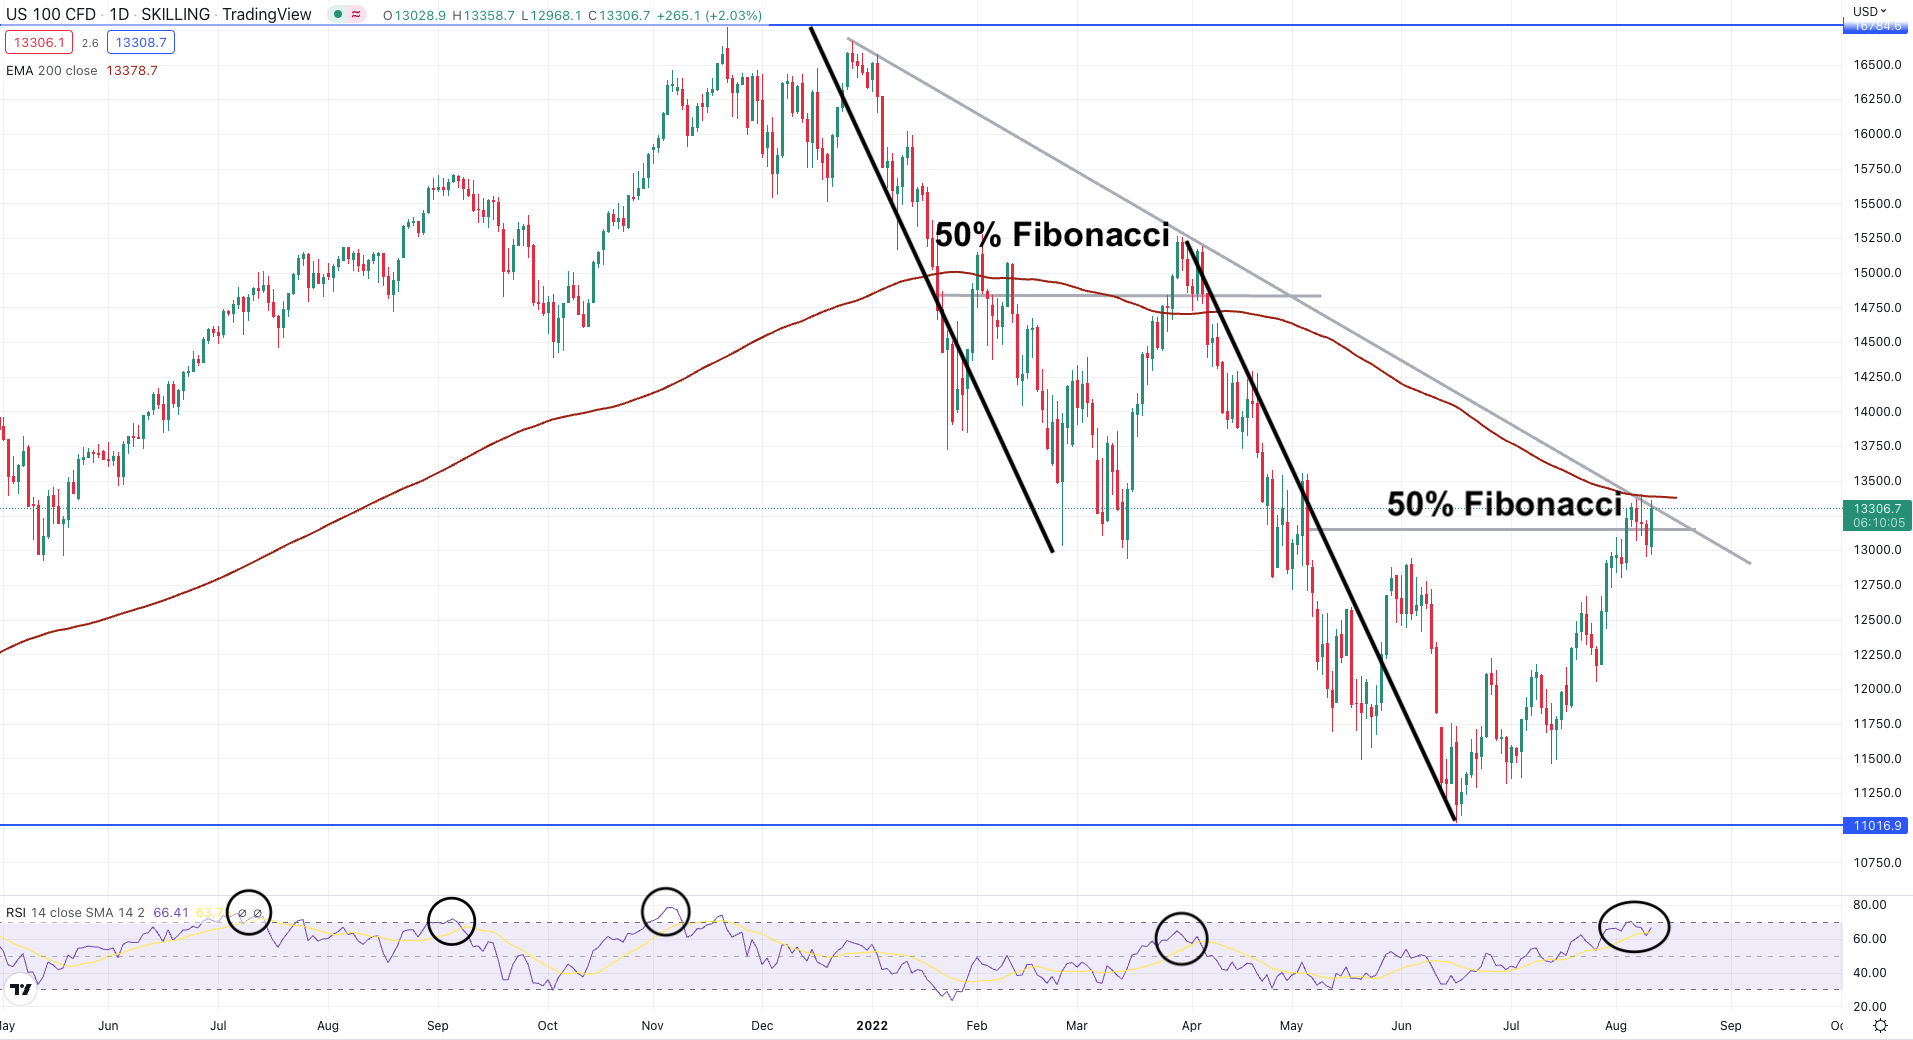
Nasdaq daily chart, source: tradingview.com
If Nasdaq breaks above the trend line and ignores other mentioned signals, it could potentially reach its ATH level from November, but many analysts are skeptical. If the market bounces back downwards, another retest of the 11,000 or breakout lower might be expected. RSI indicator also shows signs of an overbought market, pointing to a potential sell zone.
Conclusion
The unemployment rate sits at a low level of 3.5%, and inflation is finally showing signs of weakening to 8.5%, potentially leading to a better economic situation. However, Fed could still increase interest rates further, and this could do some harm.


Comments
Post has no comment yet.