Compared to the price of gold, we can clearly see that this commodity is appreciating much more slowly. Gold has already tested its 2020 highs, while silver is still 15% lower. The current price of XAG/USD – Silver Spot US Dollar is 25.57 (March 24, 2021). So, let’s move on to statistical and technical analyzes.
STATISTICAL ANALYSIS
Based on a long-term analysis of historical data, the average positive and negative daily returns are approximately 1.30% and -1.36%, respectively. The estimated daily return in both directions based on their probability of occurrence is 0.67% and -0.62%. Yesterday´s return was 2.22%, which is between the first and second standard deviation. Our scoring is currently negative (-1) for the month-on-month change and -1 for price indexation. It means that we are in a slightly negative phase of the cycle. Both scorings range from -3 up to 3. The development of the estimated cycles based on our analytical system is shown in the following chart.
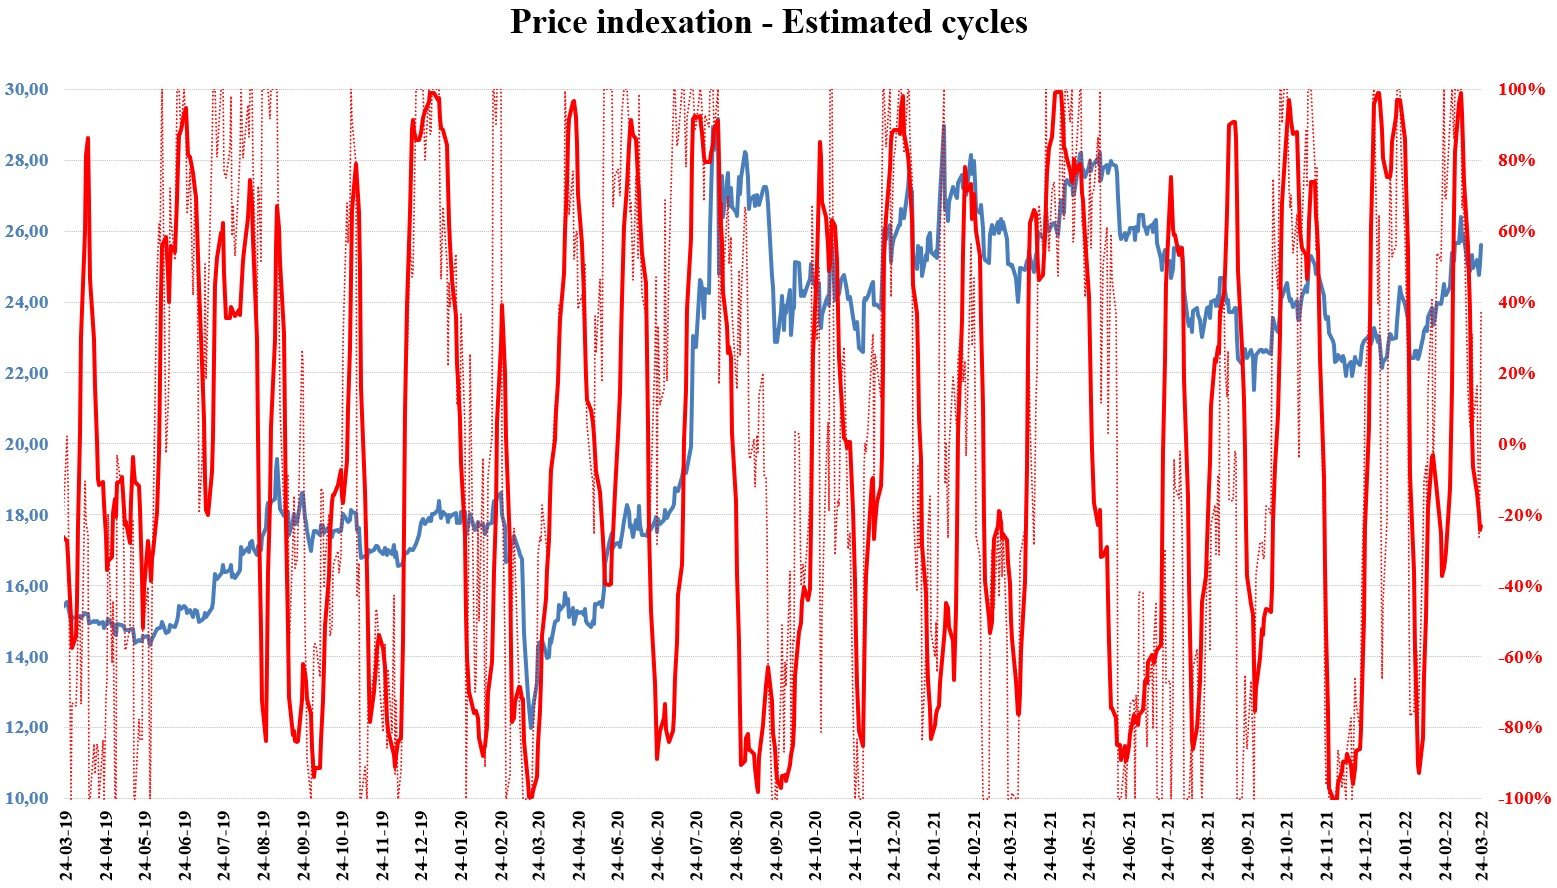
Source: WALFIR
Different moving averages (MAs) help us better identify trends across multiple time frames. We use 3 basic MAs to find out which sentiment dominates each horizon. The purple line represents the monthly , the green line the 6 months and the yellow line the annual moving average. According to the monthly MA, XAG/USD is in a bullish sentiment. In the event of a decline, short-term moving averages could also support the market price.
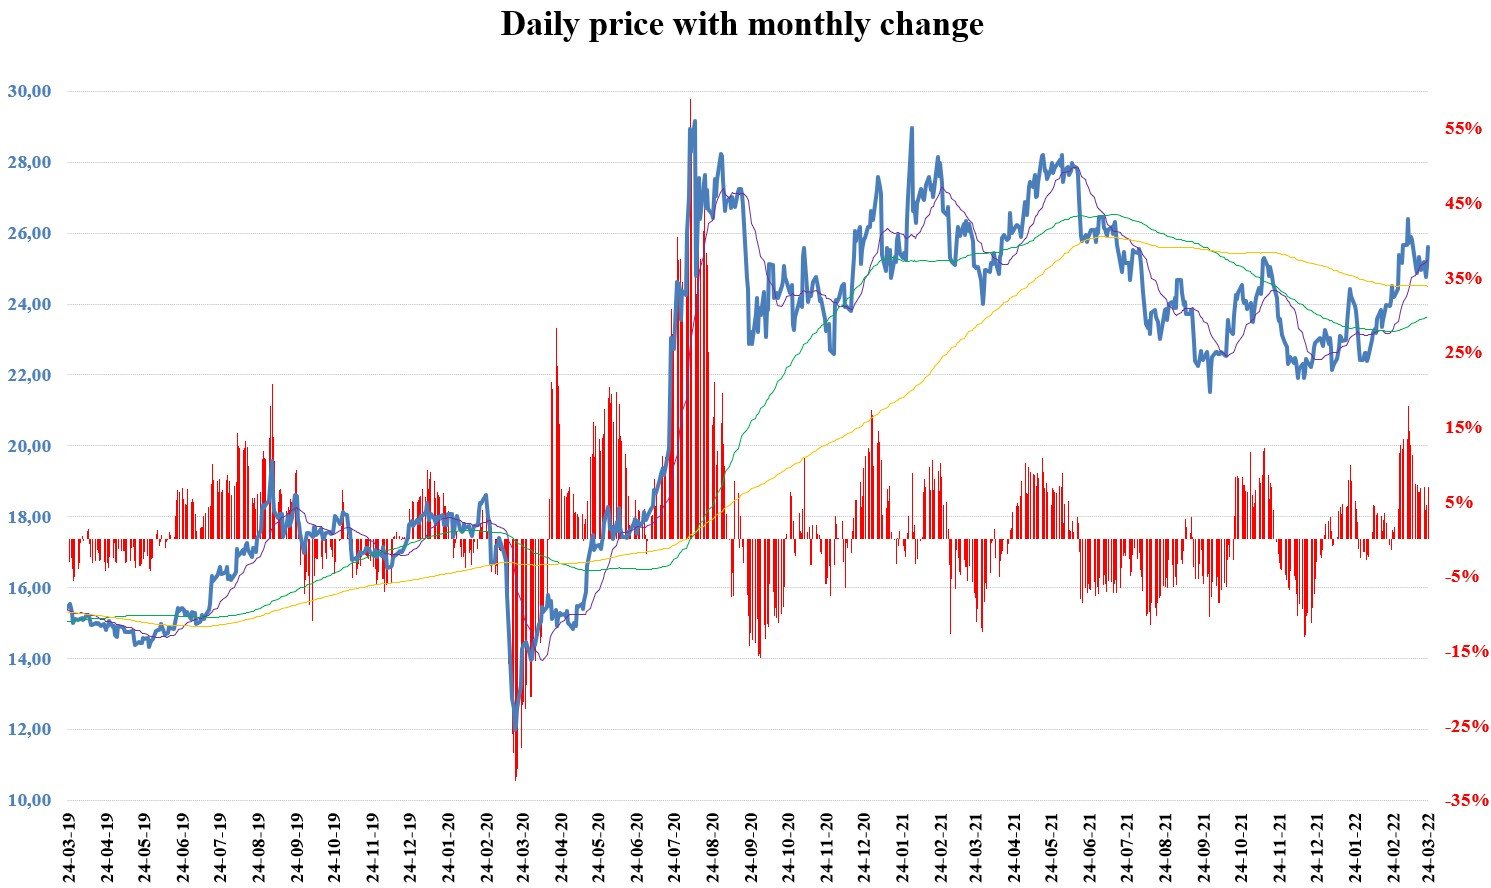
Source: WALFIR
Since our last analysis, there have been more rising trends, with a maximum of 2 consecutive days. The total maximum for the upward trends for the last 3 years is 5 days. Downward trends have not exceeded more than 2 consecutive days in recent weeks. The total maximum for the last 3 years is 8 days. We could use the average long-term ATR (Average True Range) obtained from daily data (2.50%) to estimate Stop Loss orders for our positions. The current value is 2.89%, which is slightly above average. Approximately 90% confidence interval (return between -3.00% and 3.00%) is shown in the histogram below by a red rectangle.
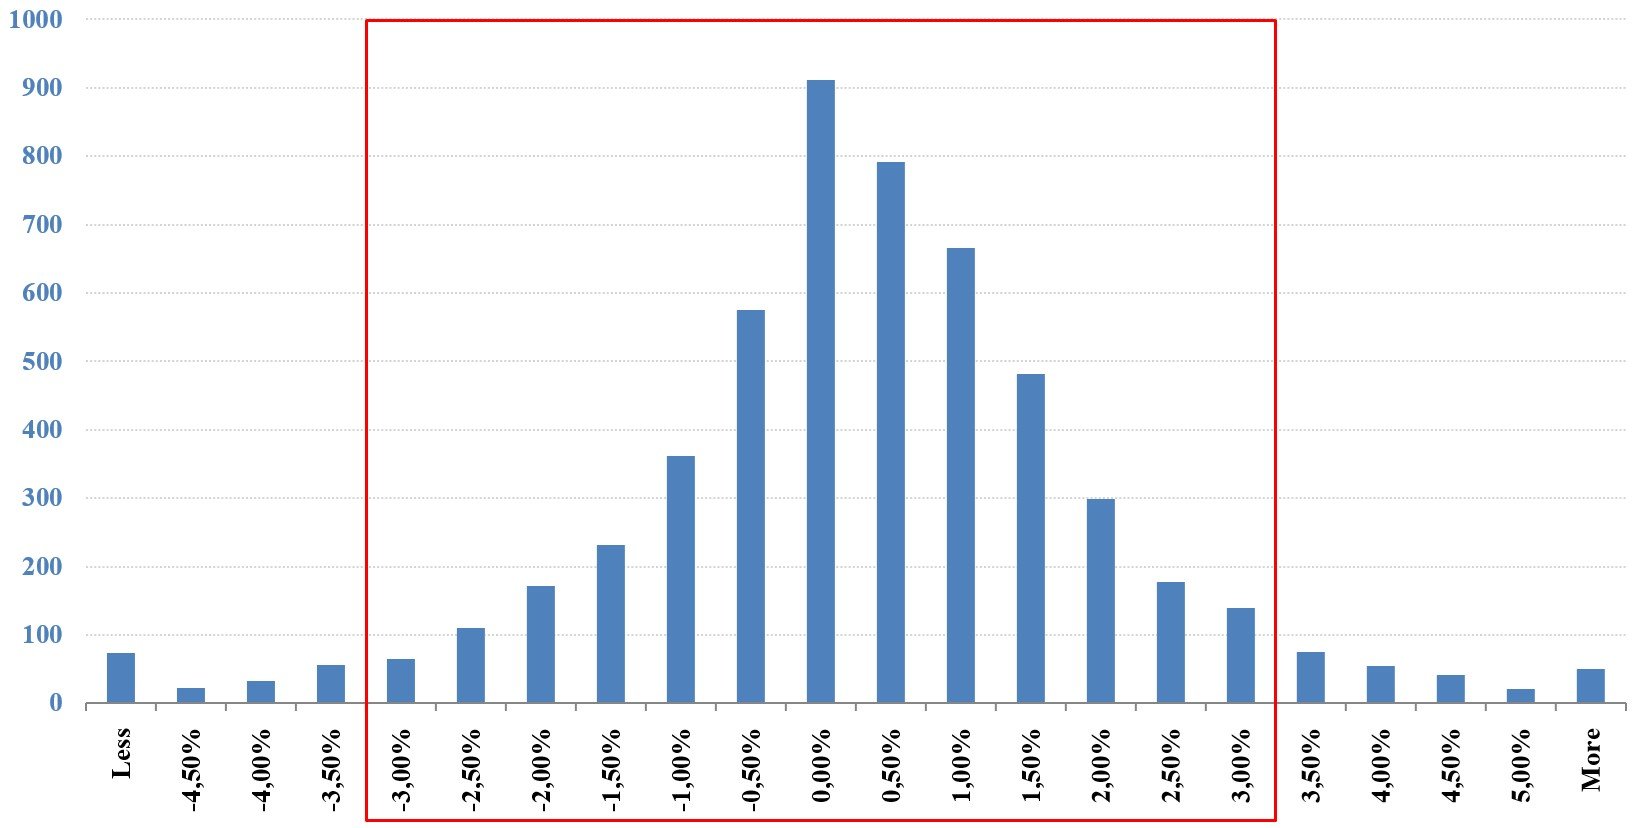
Source: WALFIR
We could use the last decile of low to high returns (4.50% ) to estimate Profit Targets, as shown in the chart below.
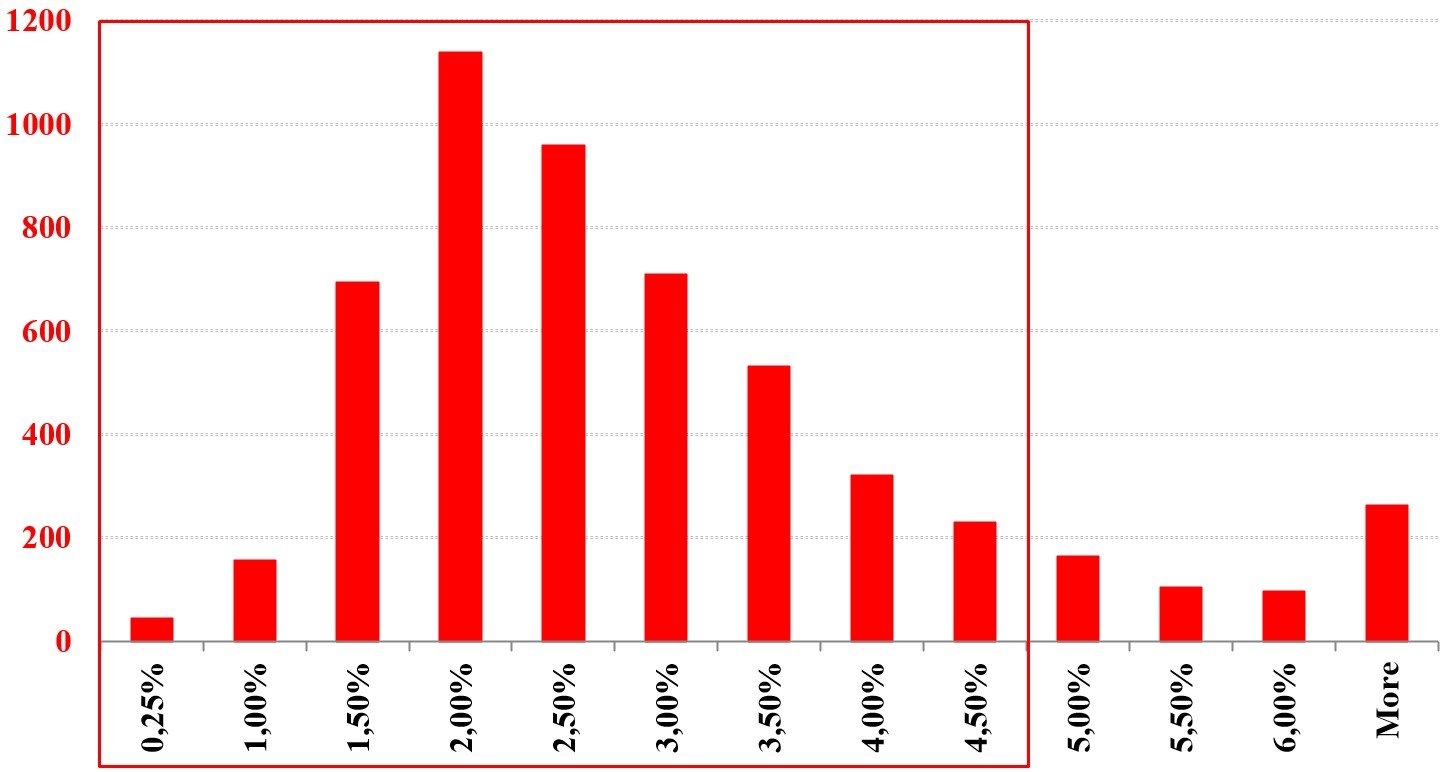
Source: WALFIR
TECHNICAL ANALYSIS
The basic technical analysis points to an uptrend this year, as the market price creates higher highs and higher lows. However, after the creation of bearish divergence, we have seen a small decline in recent weeks. XAG/USD has rebounded again from an important psychological level at 25.00. In addition, the market price is still above all moving averages and the demand zone (green rectangle), where is also 38.20% Fibonacci retracement level.
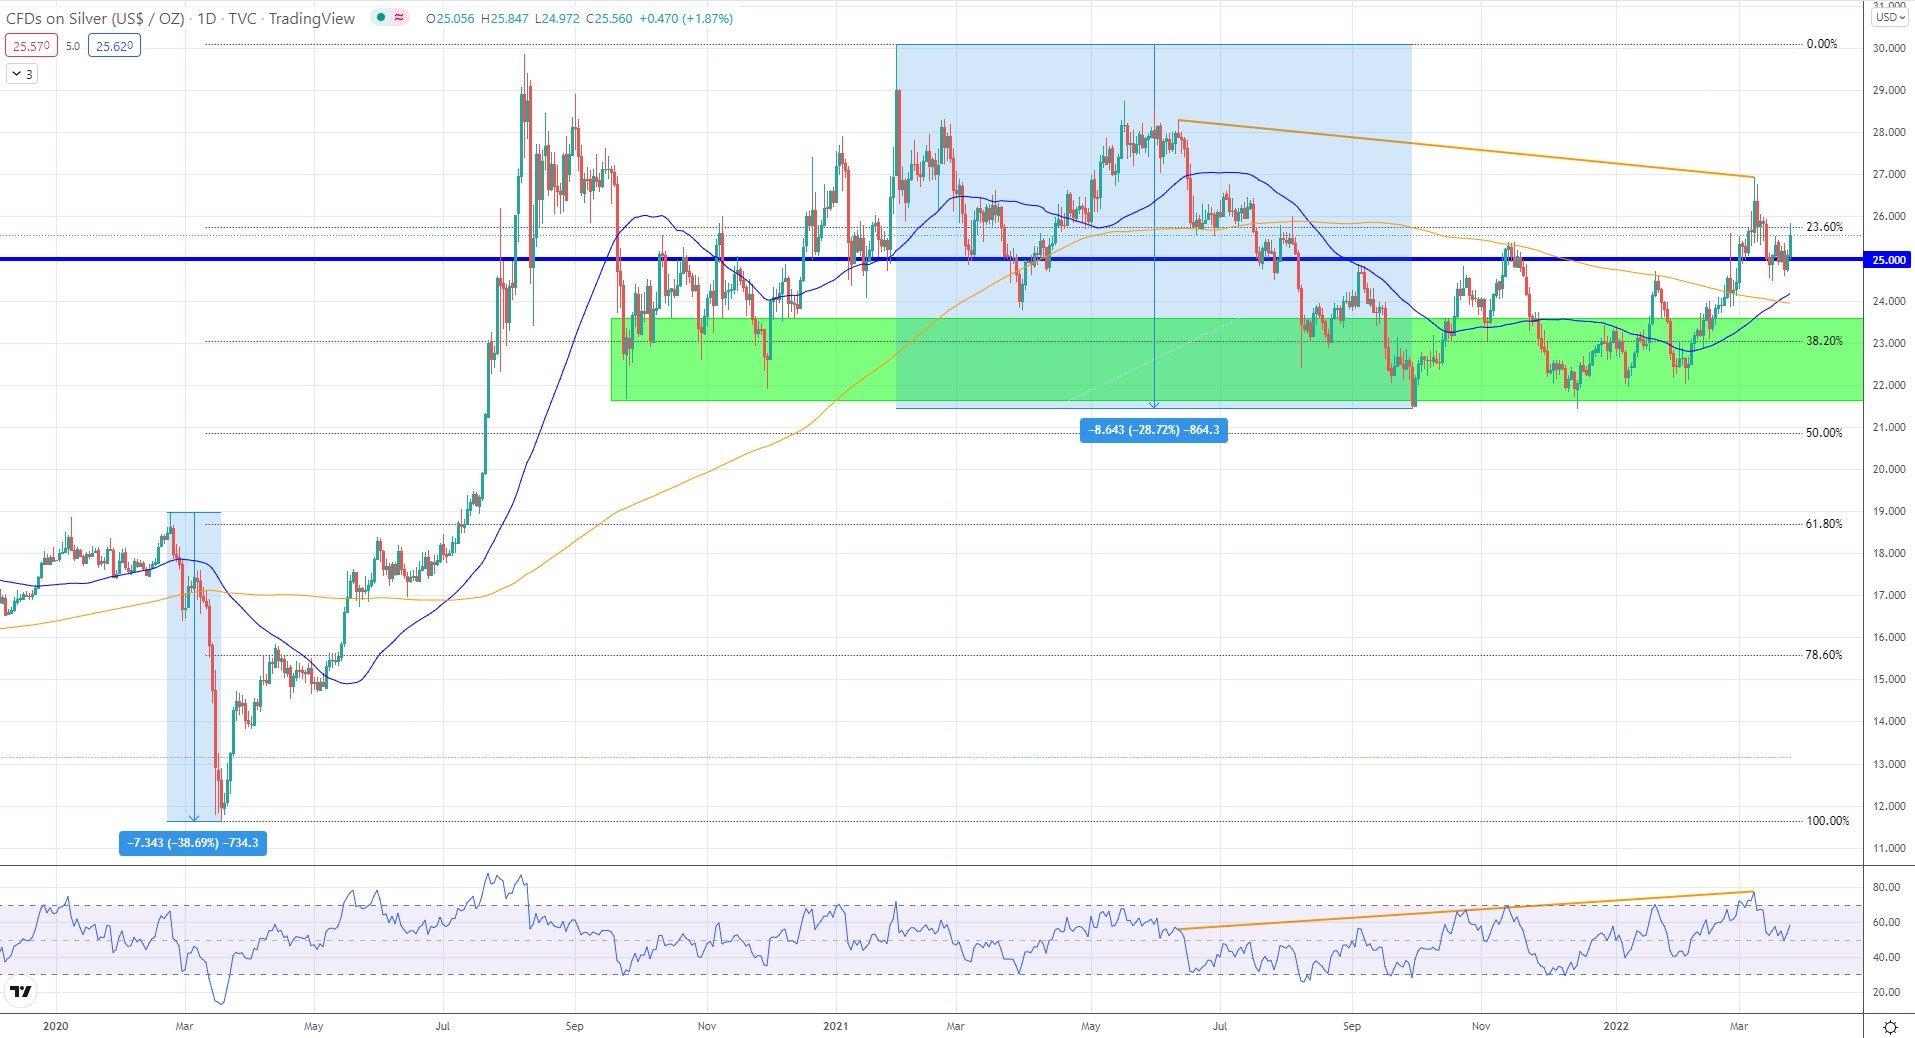
Source: TradingView
BEHAVIORAL OUTLOOK
We use COT data (Commitments of Traders) for this type of analysis. This helps us better identify potentially extreme areas and levels where traders are no longer willing to buy or sell. This could indicate a possible turning point or, in our case, a change of the trend or phase of the cycle. Our Spread is currently below negative territory, but still in above-average positive values. The moving average of our spread is stabilizing and could also turn upwards in the next period.
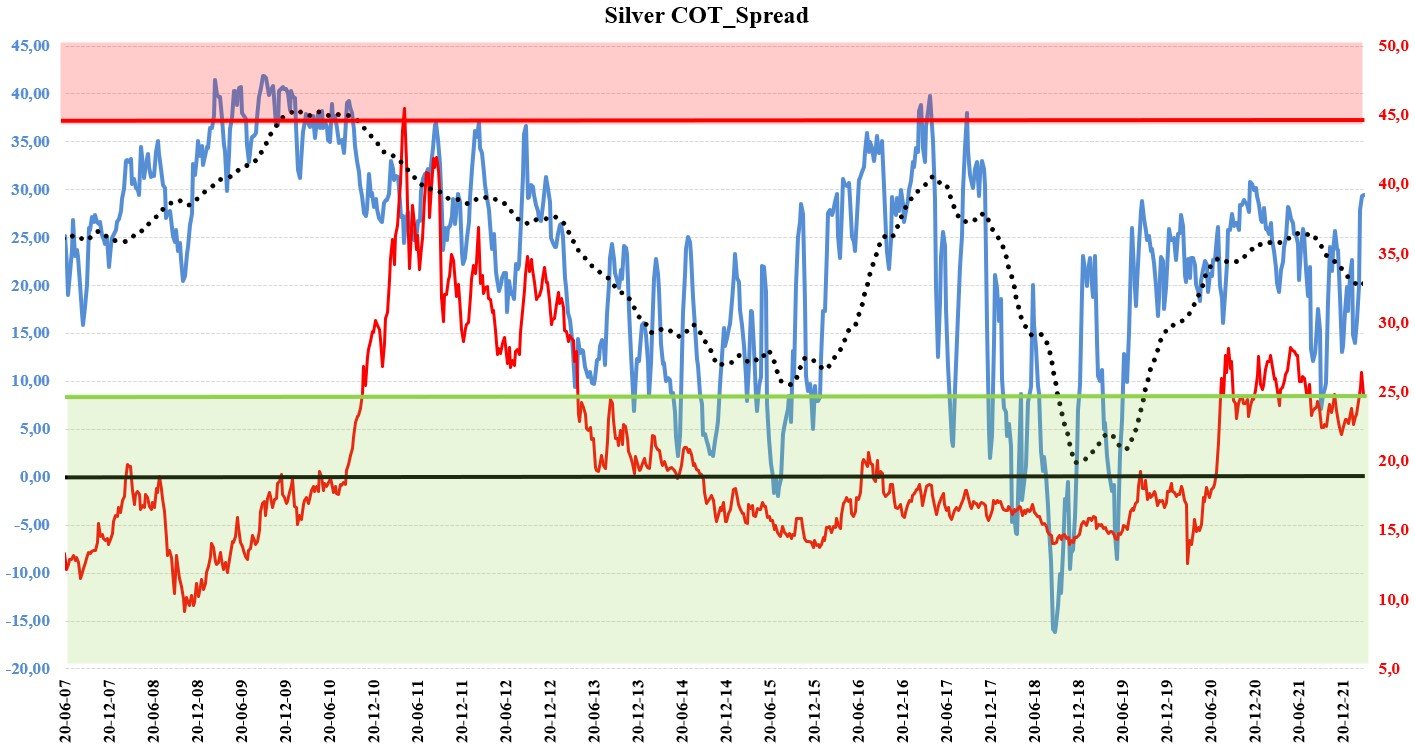
Source: WALFIR


Comments