The change in inventory by London Metal Exchange (LME) warehouses has been negative over the last 20 days. The current price of XCU/USD – Copper Spot US Dollar is 4.514 (February 18, 2022). Therefore, we will now look at statistical and technical analyzes.
STATISTICAL ANALYSIS
Based on a long-term analysis of historical data, the average positive and negative daily returns are approximately 1.27% and -1.22%, respectively. The estimated daily return in both directions based on their probability of occurrence is 0.64% and -0.59%. Friday´s return is -0.24%, which is well below the first standard deviation. Our scoring is currently neutral (0) for the month-on-month change and 0 for price indexation. This means that we are in the middle of a short-term negative phase of the cycle. Both scorings range from -3 up to 3. The development of the estimated cycles based on our analytical systems is shown in the following chart.
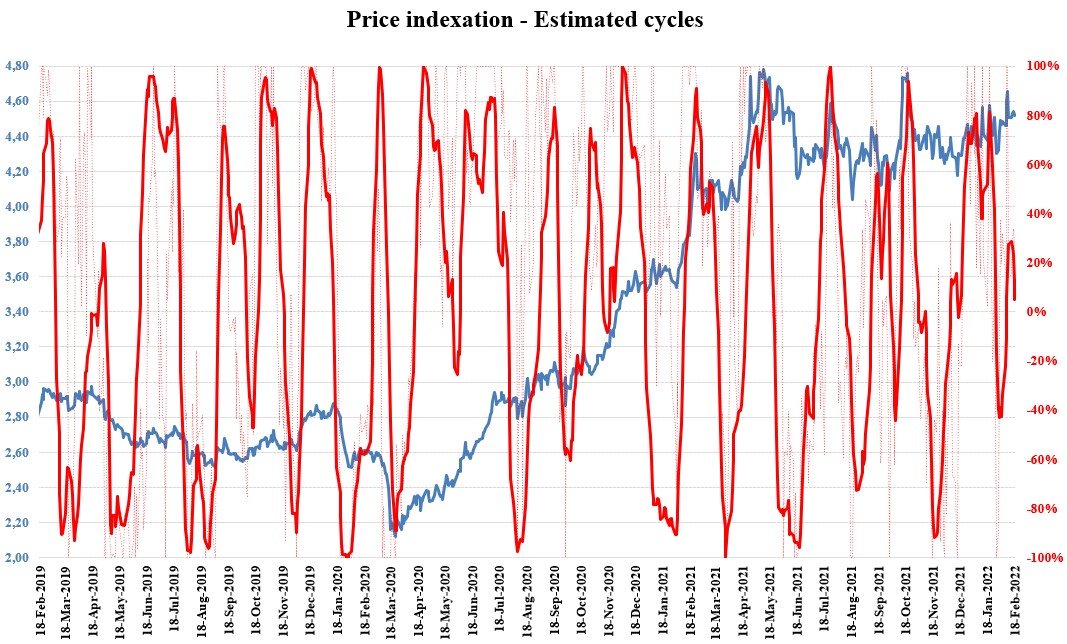
Source: WALFIR
Different moving averages (MAs) help us better identify trends across multiple time frames. We use 3 basic MAs to find out which sentiment dominates each horizon. The purple line represents the monthly , the green line the 6 months and the yellow line the annual moving average. As we can see in the chart below, all XCU/USD MAs currently support bullish sentiment. In the event of a decline, the monthly MA may be the price support.
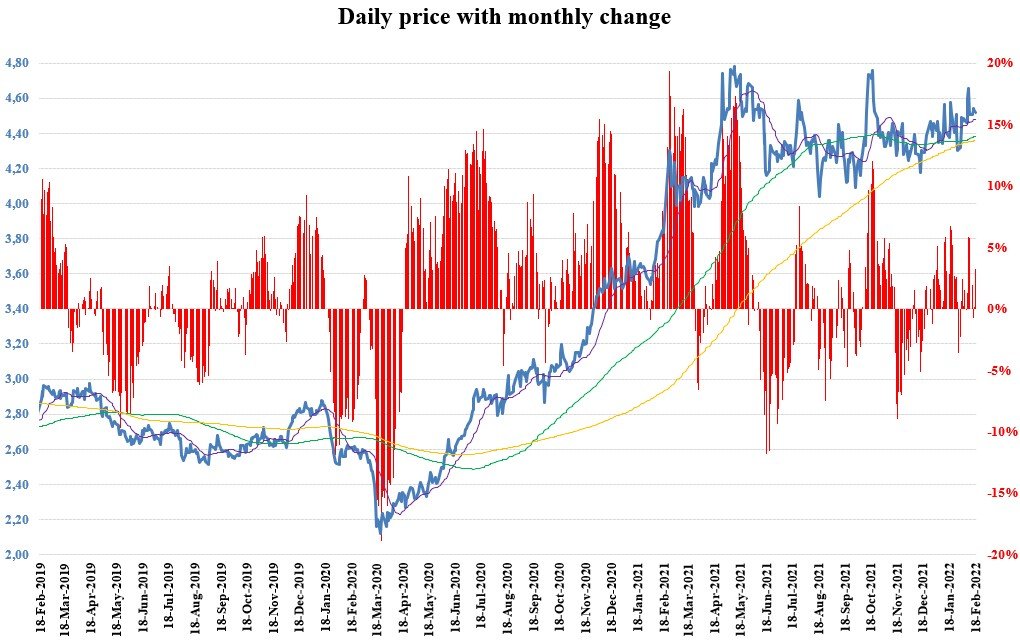
Source: WALFIR
Since our last analysis, we have witnessed several declining trends that did not exceed 2 consecutive days, even though the price is higher. The total maximum in the measured period (last 3 years) is 12 days. The upward trends in recent months have not exceeded more than 2 days. The total maximum for the last 3 years is 14 days. We could use the average long-term ATR (Average True Range) obtained from daily data (1.91%) to estimate Stop Loss orders for our positions. The current value is 1.08%, which is below average. Approximately 90% confidence interval (return between -2.50% and 2.50%) is shown in the histogram below by a red rectangle.
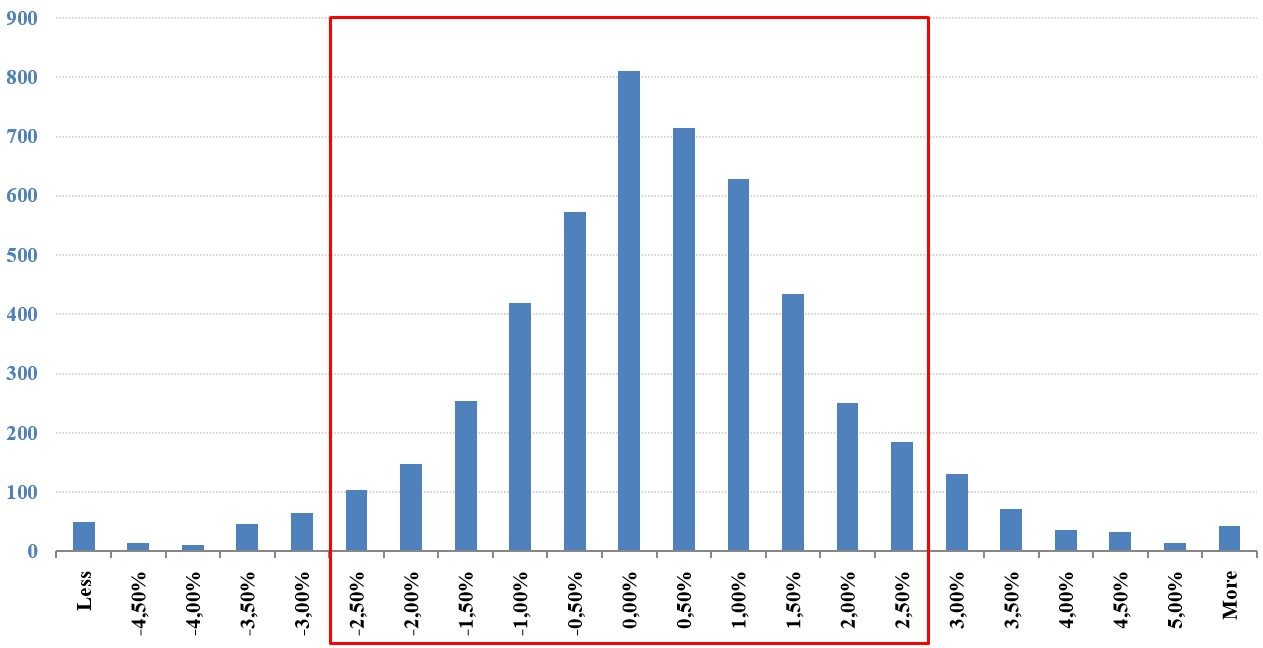
Source: WALFIR
We could use the last decile of low to high returns (3.00% ) to estimate Profit Targets, as shown in the chart below.
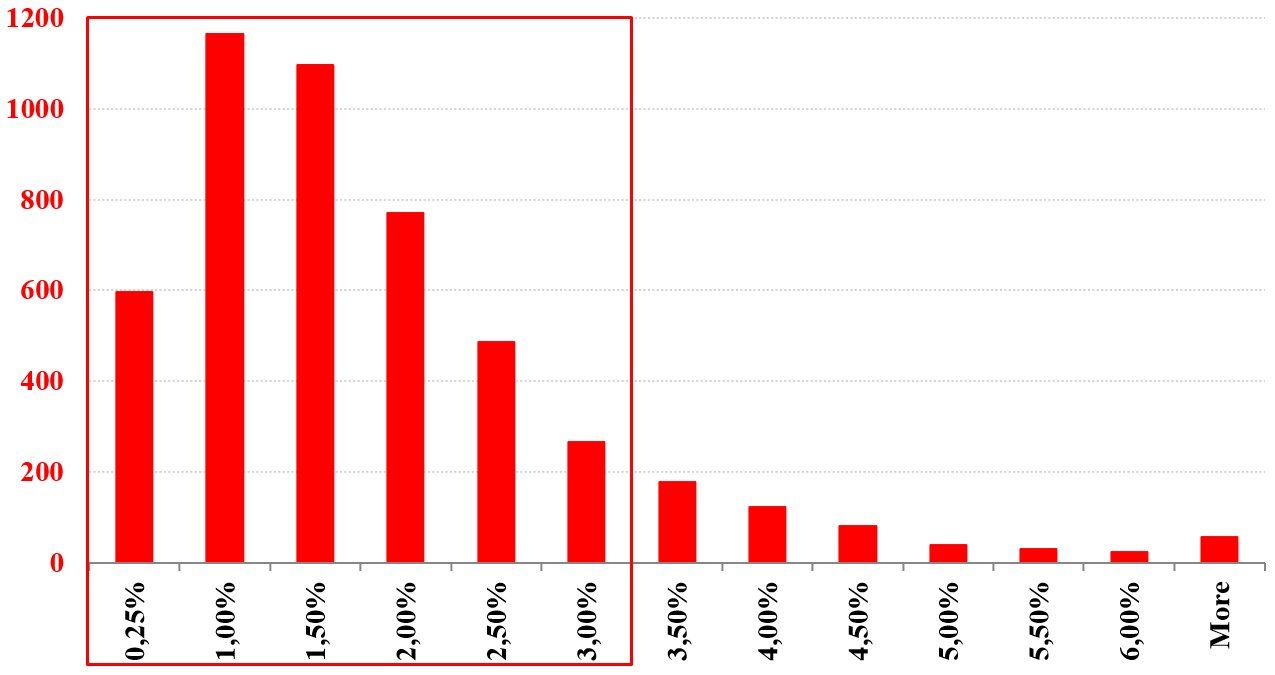
Source: WALFIR
TECHNICAL ANALYSIS
A basic technical analysis points to a sideways trend since March 2021. The channel ranges from approximately 4.000 USD up to 4.800 USD. The lower boundary of the channel is formed by the psychological level and the demand zone (green rectangle). The upper boundary of the channel is also formed by the psychological level and the supply zone (red rectangle). The XCU/USD is currently above the short-term and long-term moving averages, which could act as supports. In addition, volumes have increased in recent days.
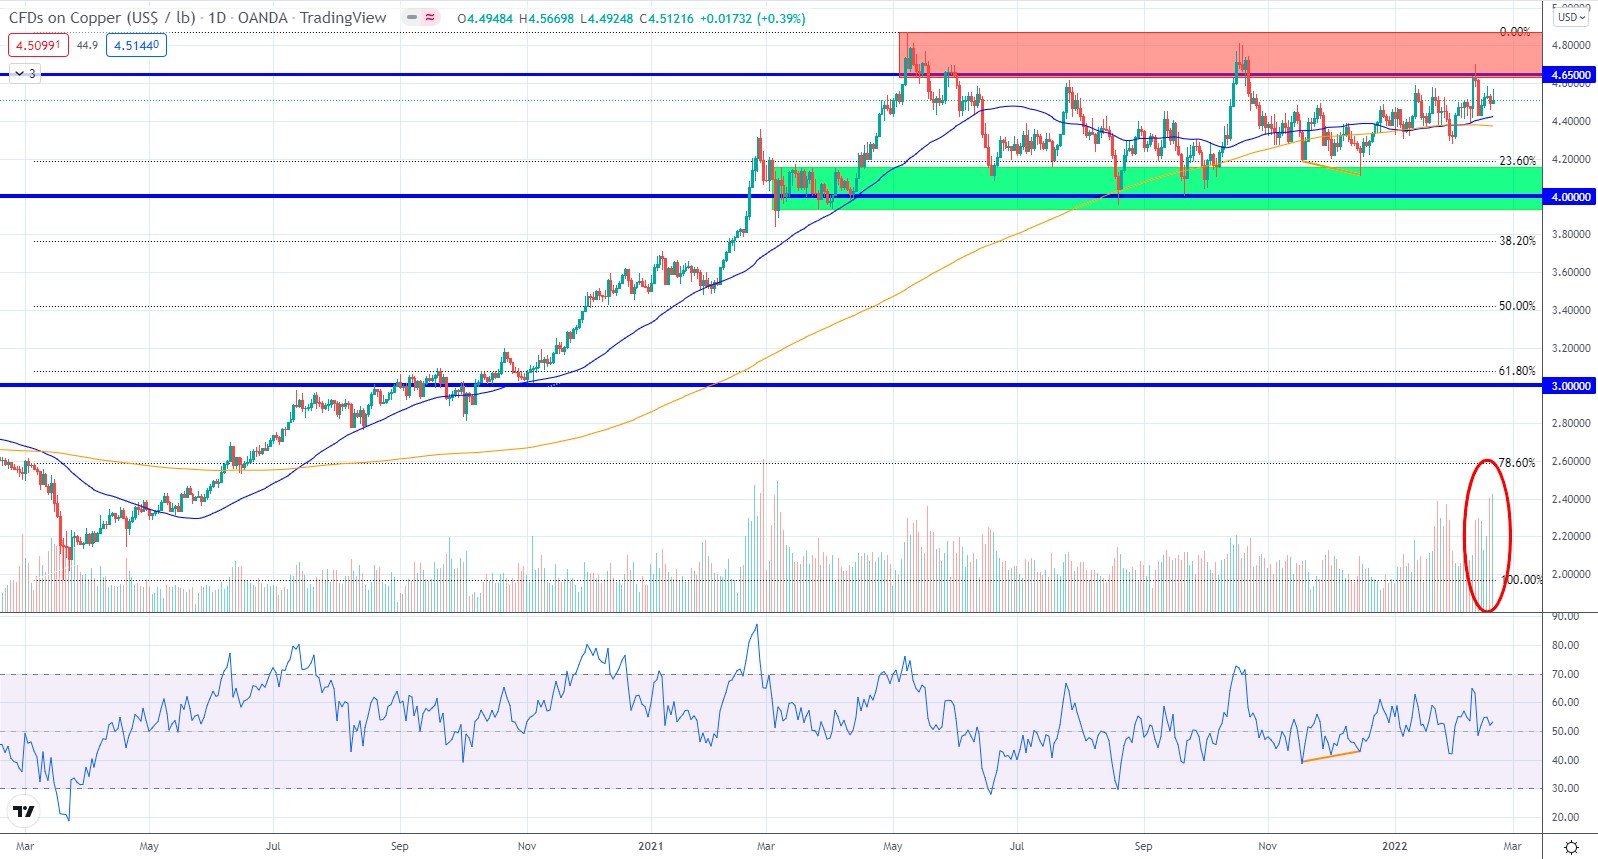
Source: TradingView
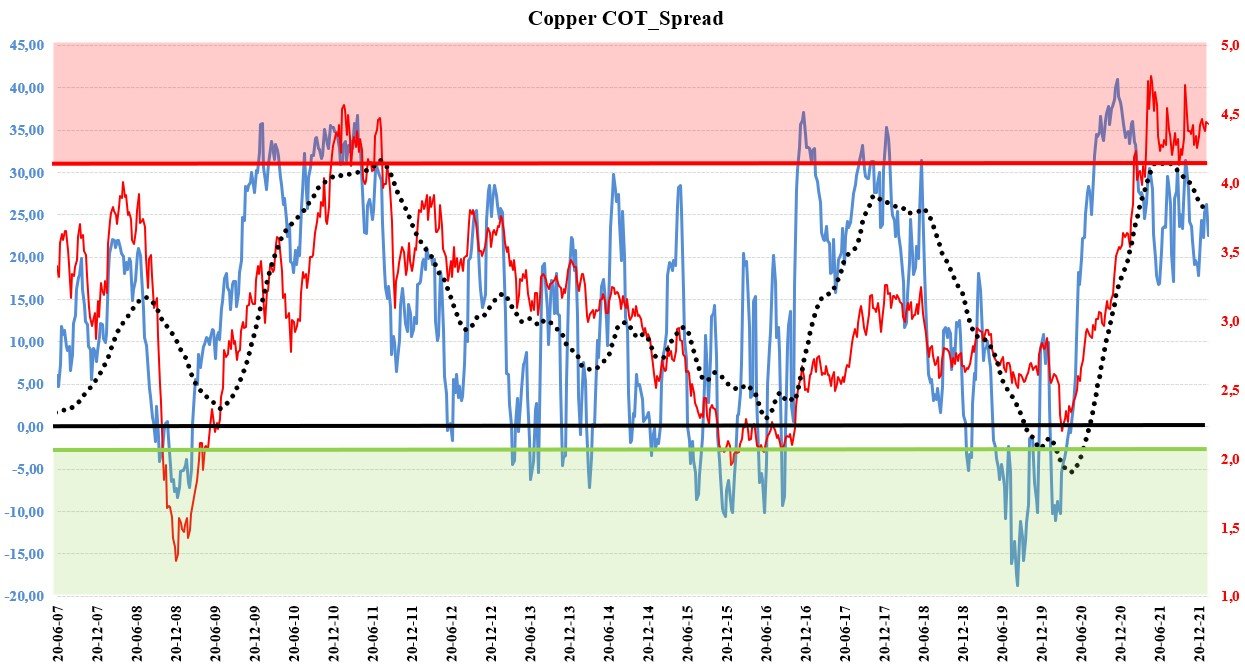
BEHAVIORAL OUTLOOK
We use COT data (Commitments of Traders) for this type of analysis. This helps us better identify potentially extreme areas and levels where traders are no longer willing to buy or sell. This could indicate a possible turning point or, in our case, a change of the trend or phase of the cycle. Our Spread is currently below negative territory, but still in above-average positive values. The moving average of our spread also rotates from a rising to a falling phase, which could motivate bears.


Comments