This precious metal declined dynamically in March and the free fall continues this month. However, it is currently in an important zone again. The current price of XPT/USD – Platinum Spot US Dollar is 954 (April 07, 2022). So, let’s move on to statistical and technical analysis.
STATISTICAL ANALYSIS
Based on a long-term analysis of historical data, the average positive and negative daily returns are approximately 1.04% and -1.08%, respectively. The estimated daily return in both directions based on their probability of occurrence is 0.53% and -0.51%. Today´s return was 0.05%, which is well below the first standard deviation. Our scoring is currently neutral (0) for the month-on-month change and 0 for price indexation. Both scorings range from -3 up to 3 and are currently in the extreme downward phase of the cycle. The development of the estimated cycles based on our analytical system is shown in the following chart.
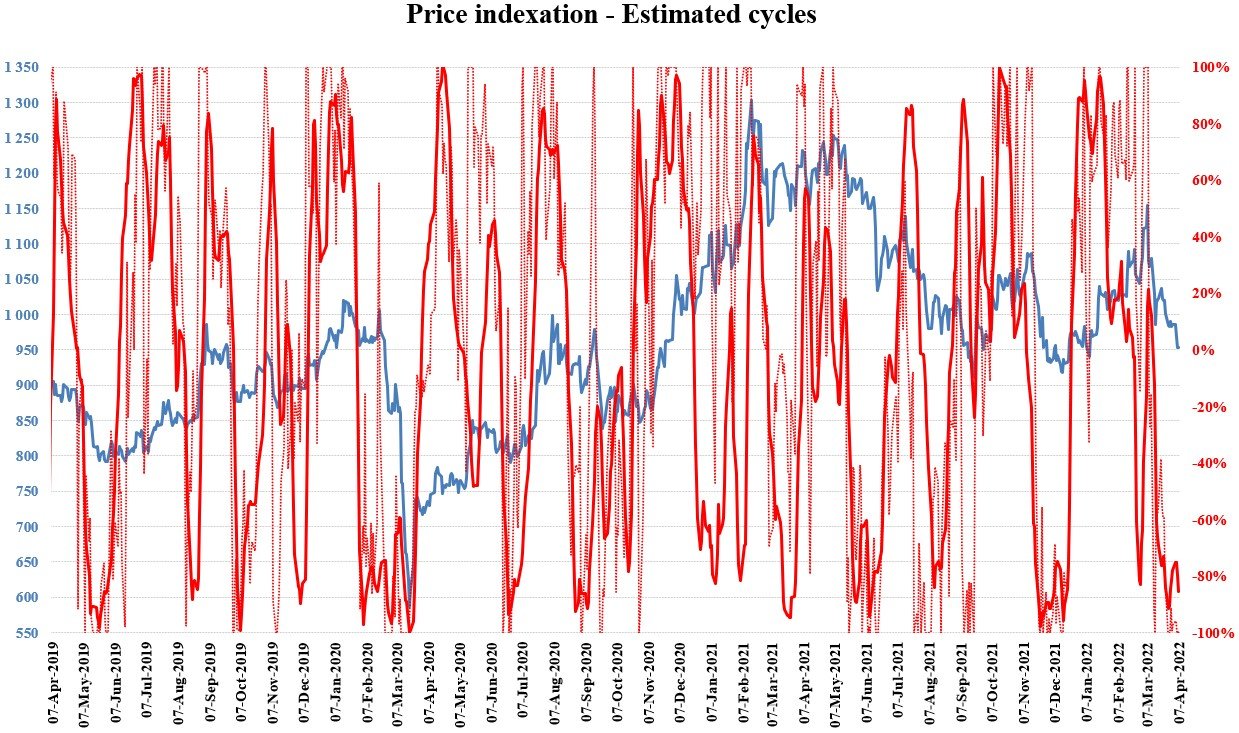
Source: WALFIR
Different moving averages (MAs) help us better identify trends across multiple time frames. We use 3 basic MAs to find out which sentiment dominates each horizon. The purple line represents the monthly , the green line the 6 months and the yellow line the annual moving average. As we can see in the chart below, bearish sentiment currently supports all MAs. In the case of growth, monthly and 6-month MAs can be the price resistance.
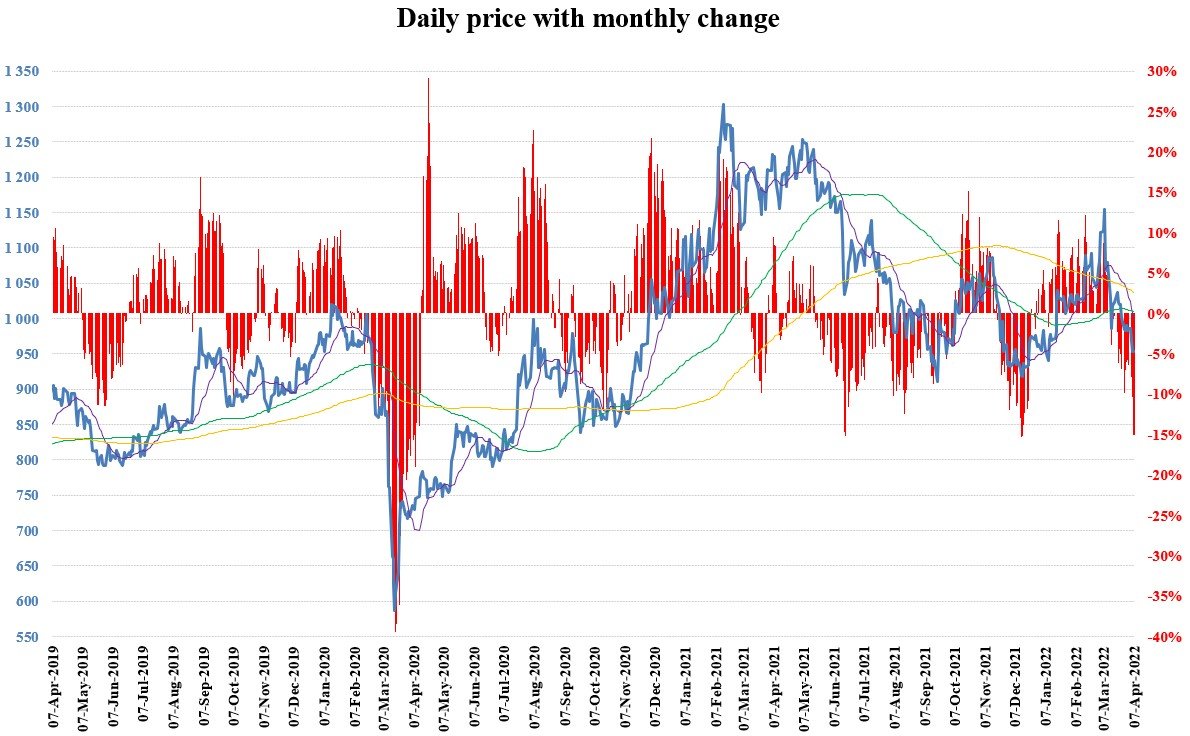
Source: WALFIR
Since our last analysis, we have witnessed more upward trends, although the market price is lower. They did not exceed 5 days. The total maximum in the measured period (last 3 years) is 6 days. Downward trends did not exceed more than 2 days in the same period. However, the total maximum for the last 3 years is 7 days. We could use the average long-term ATR (Average True Range) obtained from daily data (3.07%) to estimate Stop Loss orders for our positions. The current value is 2.33%, which is below average. Approximately 90% confidence interval (return between -2.40% and 2.40%) is shown in the histogram below by a red rectangle.
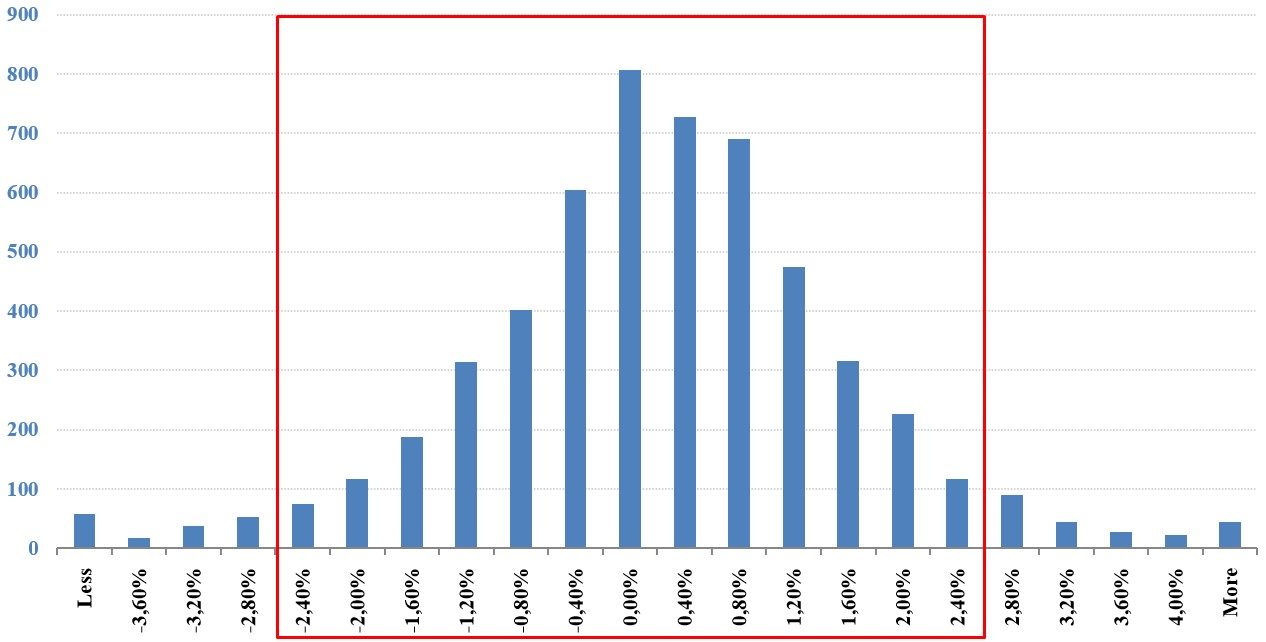
Source: WALFIR
We could use the last decile of low to high returns (3.60% ) to estimate Profit Targets, as shown in the chart below.
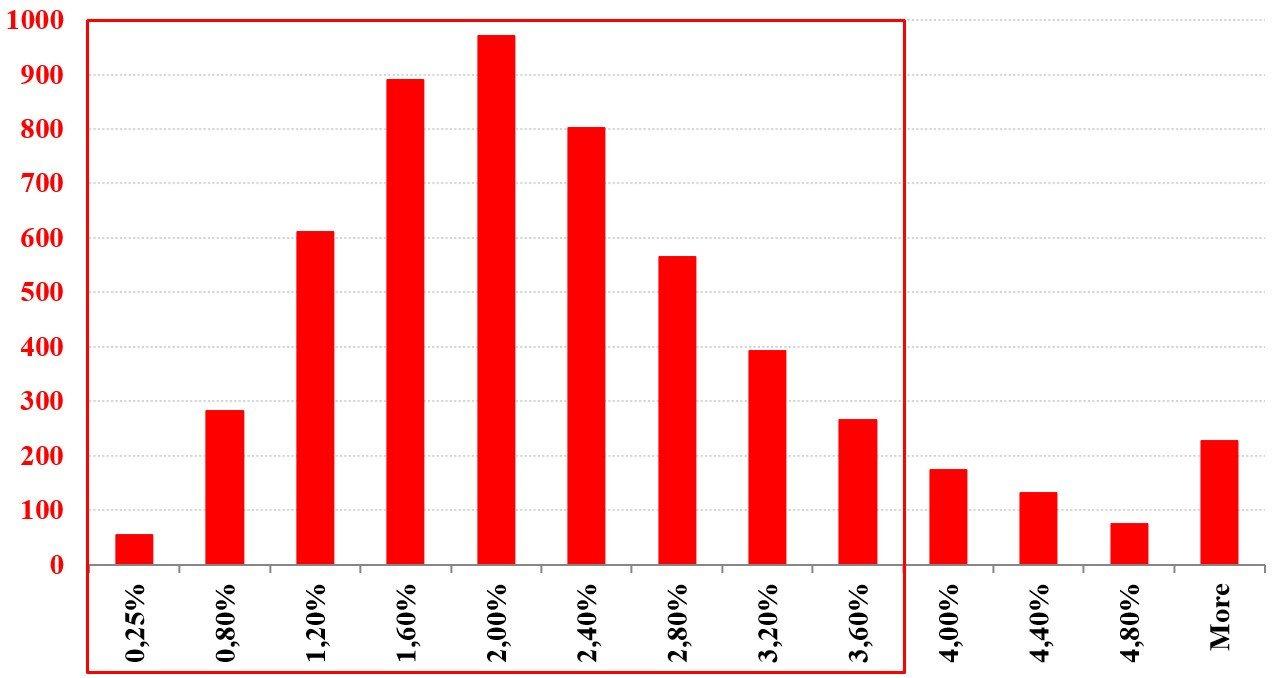
Source: WALFIR
TECHNICAL ANALYSIS
The market price has risen by 20% since the beginning of this year and has fallen to around this year’s opening price in March. However, XPT/USD is currently located in an important area of the demand zone (green rectangle), where are the 50.00% Fibonacci retracement level and the psychological level at 1 000. In addition, there is a divergence between the price development and the RSI created since January. In the case of an upward rebound, moving averages, together with the 38.20% Fibonacci retracement level can be the price resistance.
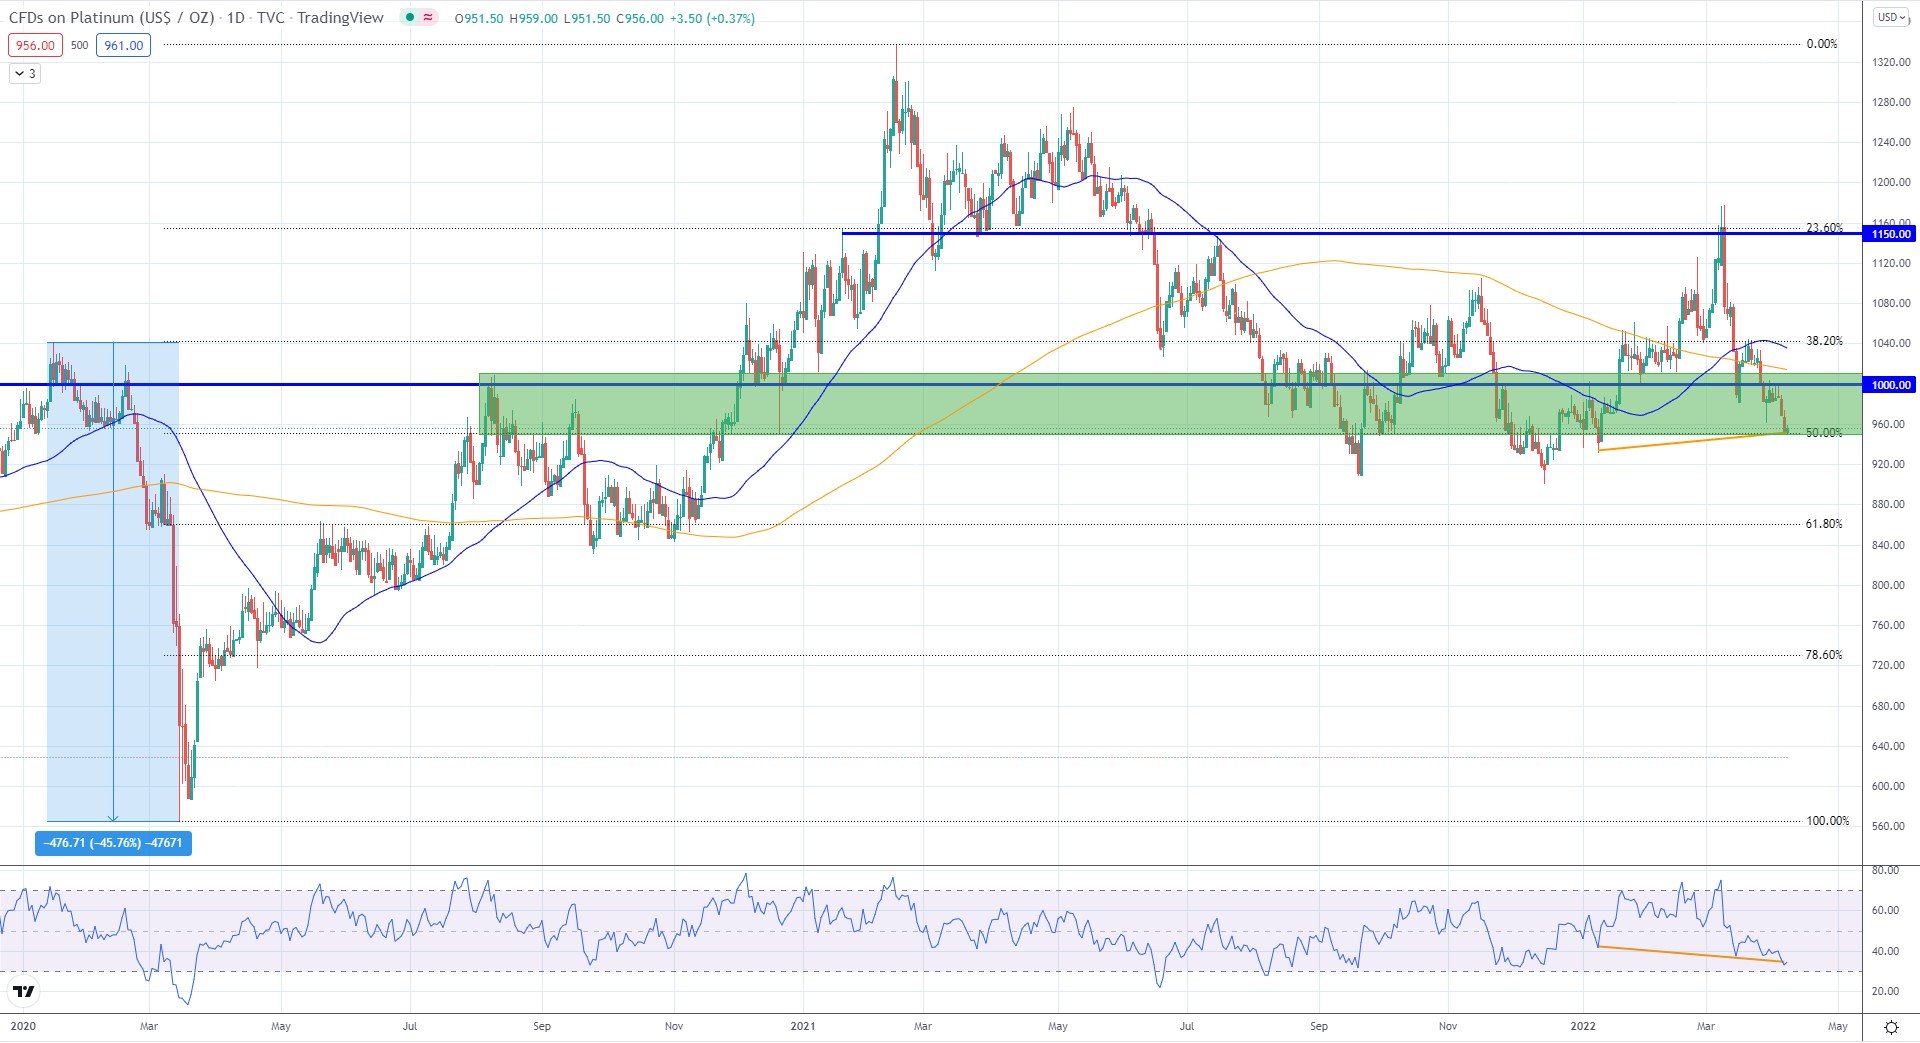
Source: TradingView


Comments