Soft Eurozone activity
The latest economic news from Eurozone showed a worsening economic situation. A year-to-year inflation rate climbed to 8.6% from an estimated 8.1%. Then, consumer confidence dropped to the new minimum at -27 points from -23.8 points. ECB hiked the interest rate to 0.5 % from the previous zero. To add, the estimation was set at 25 bps. All these data underline the current economic situation. With the recession on the horizon, fear of lower demand for crude oil and supply disruptions have sent black commodity to the year’s support at 95$.
Read more: Weekly macro report – Europe is getting the hardest hit
Moving average – a long time period indicator
Firstly, it is important to add that any indicators are not the holy grail of investing or trading. But a big helper. Indicator, price, or volume one, is just one piece of a puzzle in the big picture. 200 EMA on a daily time frame can show very interesting levels. The chart below shows a daily chart of crude oil futures with the 200 exponential moving average. Number 200 represents the last 200 sessions of the selected timeframe. So in the daily chart, 200 means the last 200 days used for calculation.
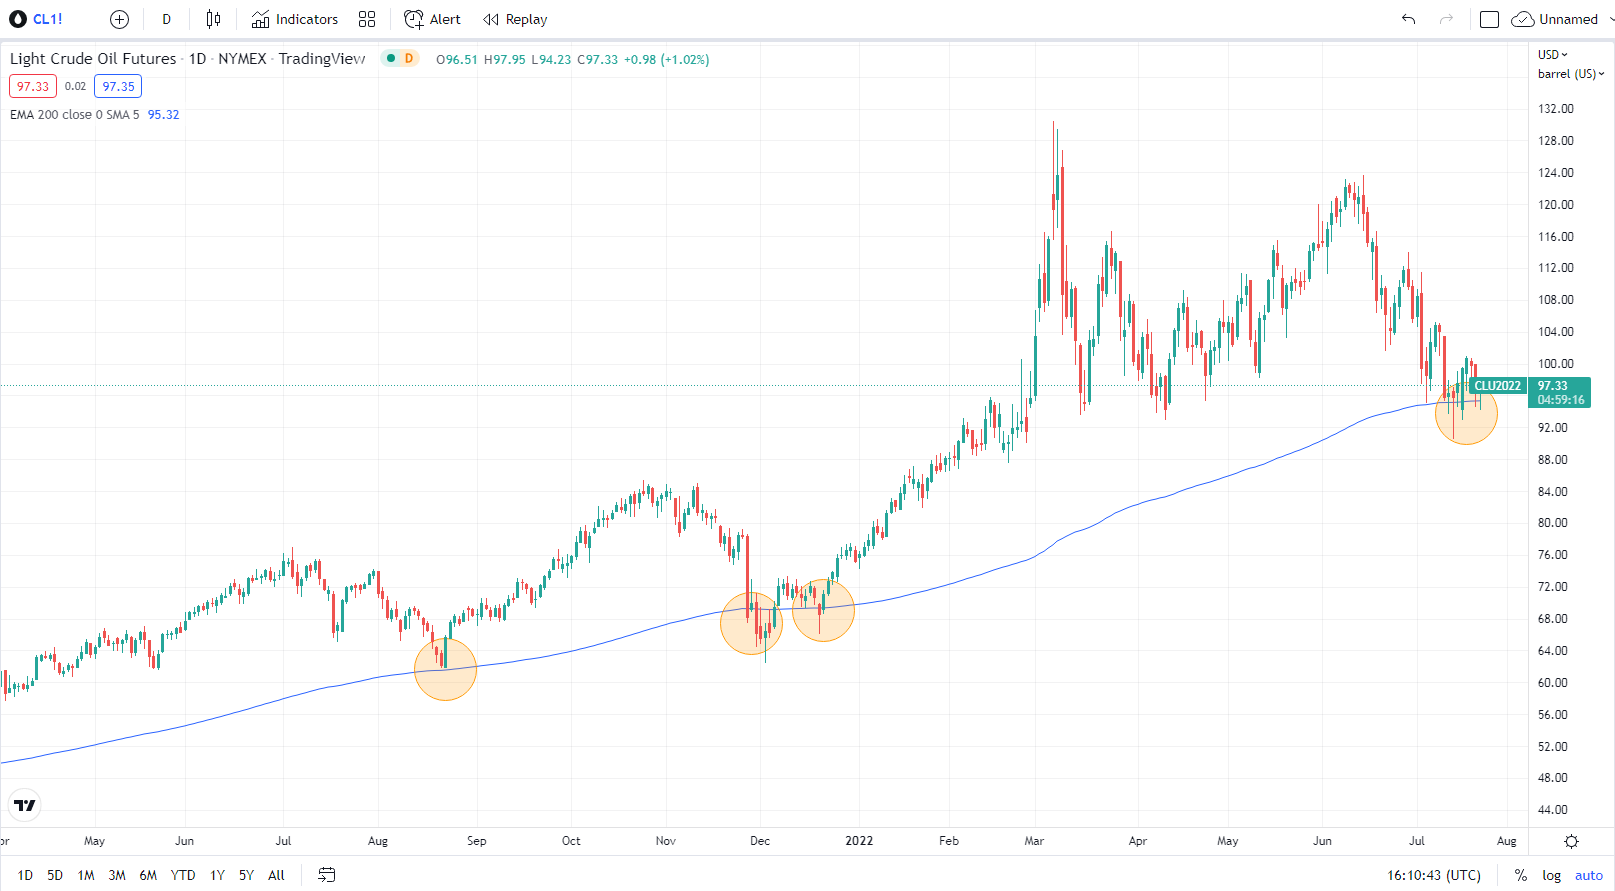
The daily chart of CL (Crude Oil Futures), 200 EMA support. Source: Author’s analysis
It is clearly seen that the price of CL is in an uptrend. Moreover, the price reacted with 200 EMA for the last 12 months. The mentioned economic situation had a negative impact on the price of a commodity. The price is testing strong support. If the price breaks this support and continues under this blue line, it could signal a possible end of the current uptrend. Another scenario could be that support will hold and the price will bounce back above the 100$ tag.
We analysed also: The Turkish lira might be on the brink of collapse
Stronger cooperation from Saudi Arabia and Iraq
The situation with crude oil support for Europe is in better shape in comparison with natural gas. The last data from Bloomberg shows that the import of crude oil from Saudi Arabia and Iraq doubled in the last 12 months. Therefore, possible supply disruptions of crude oil should not have to be so massive as fear of natural gas disruption. Fundamental analysis has the lead now and some price indicators will not stop the sentiment. But, price reaction in recent months showed that 200 EMA is, at least, an interesting level to watch.


Comments
Post has no comment yet.