Gold, copper, silver, zinc, and lead are some of the metals that Newmont Corp. is involved in exploring and producing. The main regions where NEM does business are North America, South America, Australia, and Africa. The Colorado-based company was established in 1916 and currently runs a number of operational mines in Nevada, Ghana, Australia, and Peru.
Disappointing Results and Worsening Forecasts
Over the past year, NEM has suffered from earnings misses. Three out of the previous four quarters saw the mining business miss forecasts, with an average shortfall of -9.75% over that time. The most recent Q2 earnings from NEM were $0.46 per share in July, falling short of the $0.60 average forecast by -23.33%. You’ll be up against it when it comes to the stock price if you’re routinely exceeding profits projections by a significant margin.
You may also read: EUR/USD soars 1% to 1-month high
All of the analysts that cover NEM are in accord and have reduced their profit projections. Over the last 60 days, projections for the year have dropped 20.91%. The Zacks Consensus Estimate is now $2.61 per share, representing a decline of -11.82% from the prior year. The bears want to see negative trends of this nature.
Daily chart seems bearish
The price of NEM shares has been decreasing gradually since April; it has now entered a clearly defined bear market after plummeting -47.8% from its peak. Over the previous year, shares have decreased by more than 60%. The 50-day moving average has served as consistent resistance during the downtrend, despite the fact that the stock is still trading below both averages.
Despite today’s 5% gain in silver, the Newmont shares barely budged – trading only 2% higher, remaining close to their 2-year lows reached earlier in the month.
The current oversold conditions could help to start a short-squeeze rally, but the first resistance near 47 USD should be defended by bears. If not, another key selling zone lies at 2021 lows at around 53 USD. As long as Newmont trades below that level, the bearish trend remains intact.
However, there is a bullish divergence between the price and the RSI indicator, likely suggesting that we could have seen a short-term bottom.
On the downside, the key support now stands at 40 USD, and if not held, the price might drop further toward 35 USD.
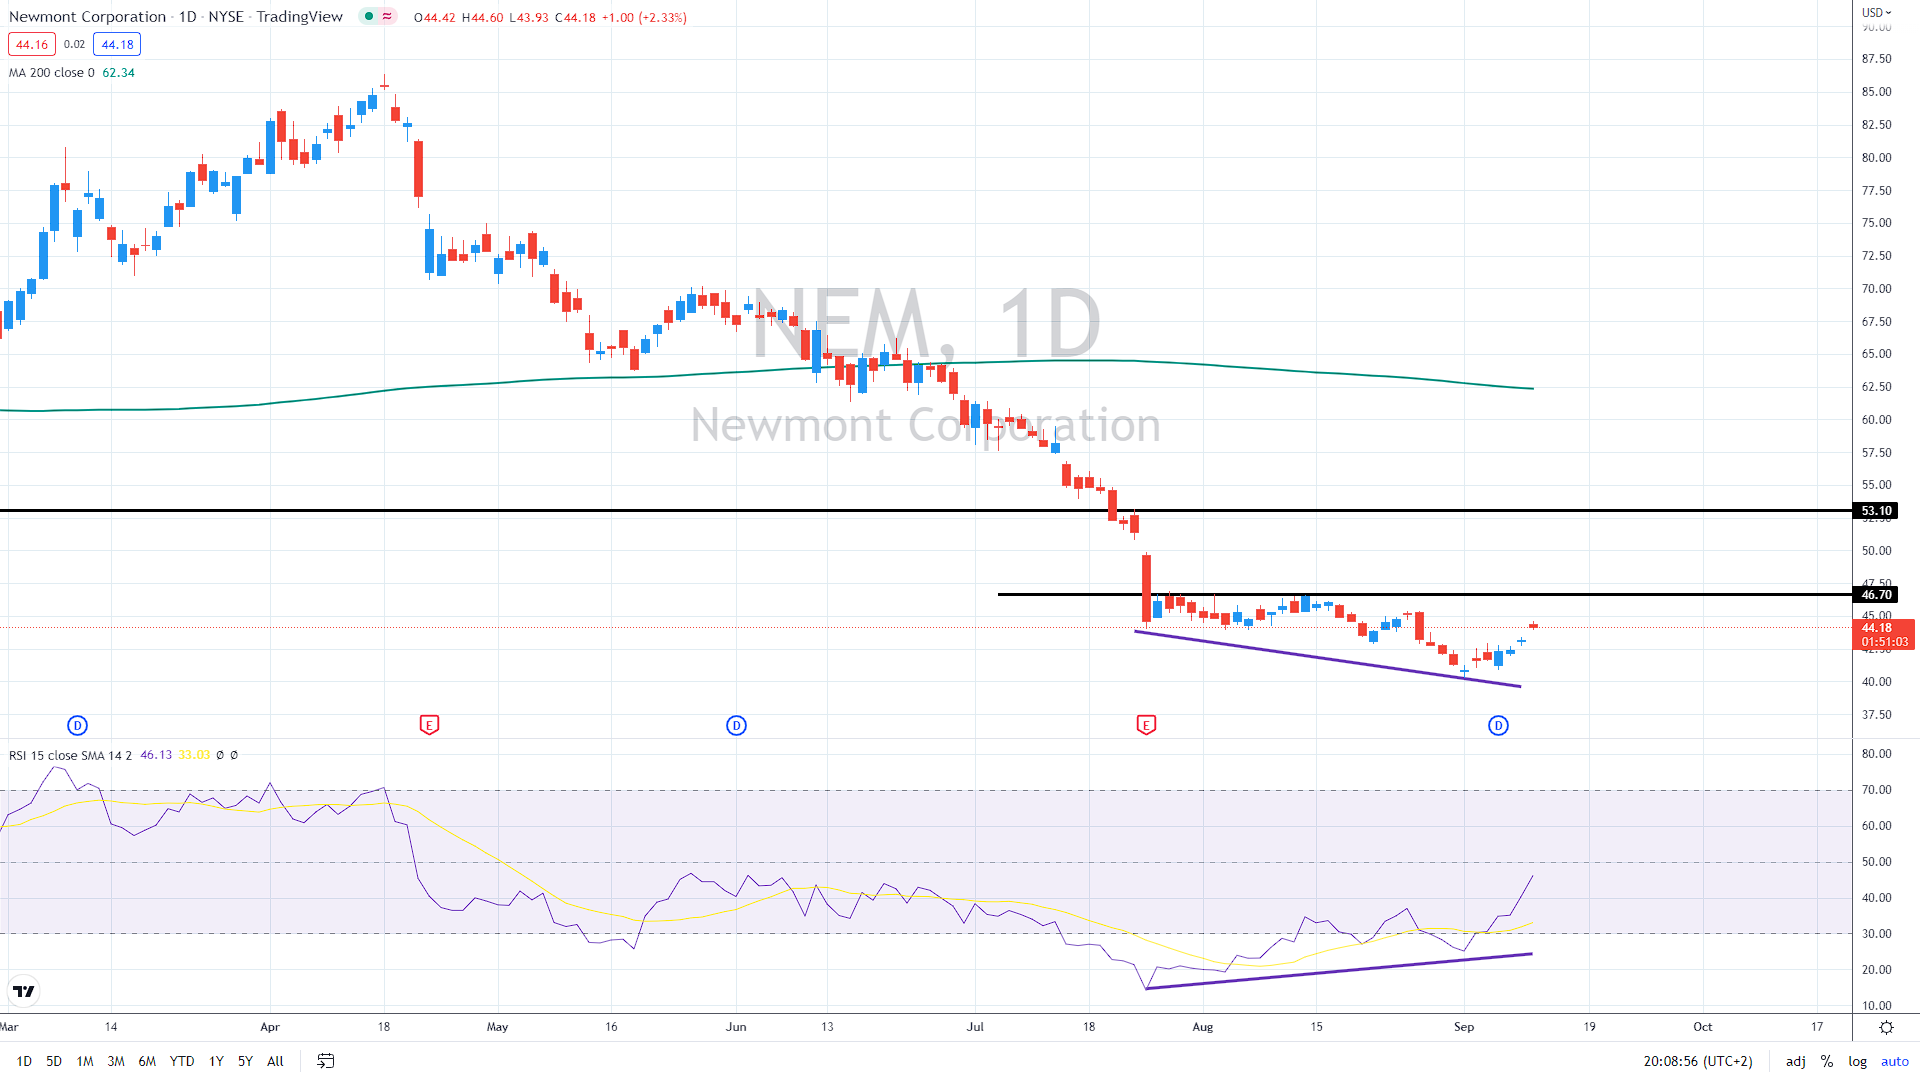
NEM daily chart, Source: Author´s analysis, tradingview.com


Comments
Post has no comment yet.