With daily trading volumes exceeding $5 trillion, forex trading is a popular method for participating in the financial markets. To be a successful forex trader, one must be able to comprehend and interpret forex charts. Forex charts are graphical representations of the fluctuating prices of currency pairs. Traders can make well-informed trading decisions with the help of the charts’ vital information on market trends and patterns. In this article, we will examine the various varieties of forex charts, how to interpret them, and some analysis strategies for forex charts.
Variations of forex charts
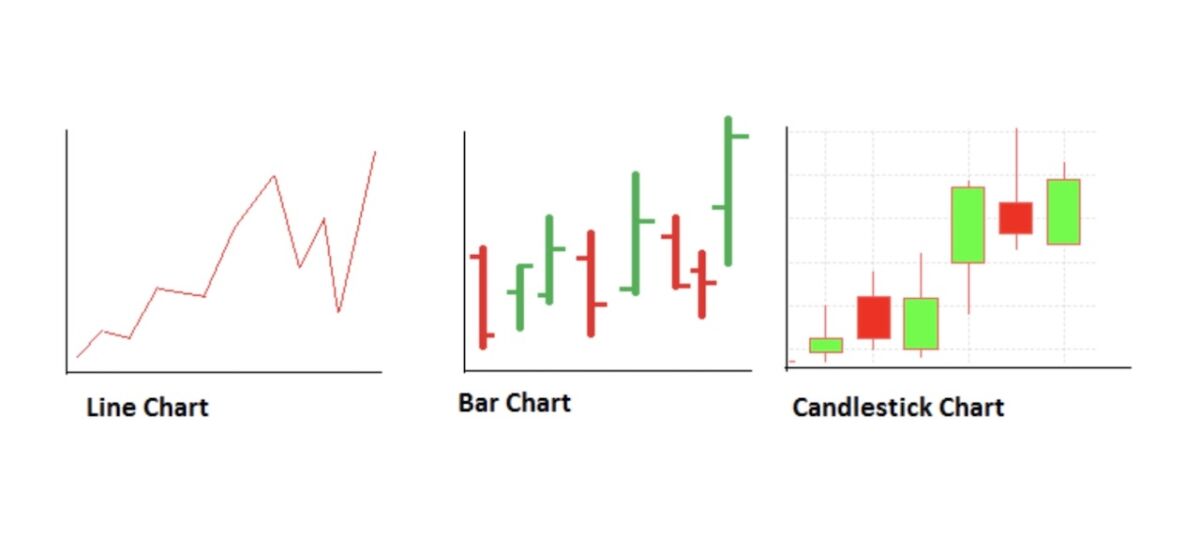
Line charts, bar charts, and candlestick charts are the three primary varieties of forex charts.
Line charts
Line charts are the most basic forex chart variety. They graph the closing exchange rates of currency pairs over time and connect the points with a line. Line charts help identify long-term forex market trends. However, they do not provide a great deal of information regarding the price action during a particular period.
Bar graphs
The price action of currency pairs is illustrated by bar charts in greater detail. They represent the opening and closing prices of a currency pair and the peak and low prices for a specified time period. Price ranges are represented by vertical lines in bar charts, with the opening price indicated by a horizontal line on the left and the closing price indicated by a horizontal line on the right.
The use of candlestick graphs
Candlestick charts are the most widely used forex chart appearance. They provide the same data as bar charts but in a more visually attractive format. Price ranges are represented by candlestick-shaped segments on candlestick charts. The top of the block indicates the highest price, while the bottom shows the lowest price. The block’s color indicates whether the currency pair’s closing price was higher or lower than its initial price. For example, if the block is green, the currency pair closed higher; if it is red, it closed lower.
How to read forex charts
The ability to interpret forex charts is essential for any trader. Here are the following steps:
Set the timeframe
Forex charts can display data for multiple timeframes, ranging from minutes to years. Therefore, traders must determine the appropriate timeframe for their trading strategy. Traders with a short-term horizon, such as day traders, commonly utilize charts that exhibit data over minutes or hours. Traders with a long-term perspective use charts that display data over weeks, months, or years.
Examining price action
To identify trends and patterns, traders must examine the price action of currency pairs over time. Various technical indicators, such as moving averages, can assist them in identifying trends. Traders can also identify potential entry and exit positions using support and resistance levels.
Identify trading opportunities
Traders must identify trading opportunities based on their price action analysis. Then, they can employ various trading strategies to capitalize on market movements, including trend-following and counter-trend strategies. Traders may also employ stop-loss and take-profit orders to mitigate risk and secure profits.
Another interesting topic: Why should you consider investing into real estate?
Forex daily chart strategies
The daily chart is a common timeframe utilized by forex traders. It offers a healthy balance of short- and long-term trading opportunities. Here are some trading strategies for the daily chart:
Determine the trend
Traders must identify the trend of the currency pair being traded. Moving averages or trend lines can be used to identify the direction. After identifying the trend, traders can use it to inform their trading decisions.
Observe pullbacks
Before entering a trade, traders can wait for pullbacks in the direction of the trend. When the price retraces from a recent peak or low, this is known as a retracement. Traders can identify potential retracement levels using support and resistance levels.
Profit from price action patterns
Traders can identify possible entry and exit spots using price action patterns, such as candlestick patterns. For example, a bullish engulfing pattern may indicate a potential reversal in a downtrend, whereas a bearish engulfing pattern may indicate a possible reversal in an uptrend.
Manage risk
Foreign exchange traders should always manage their risk. They can utilize stop-loss orders to limit their losses if the trade goes against them. Additionally, they can use take-profit orders to secure profits if the trade goes in their favor.
Forex chart analysis
Forex chart analysis is the process of analyzing the price action of currency pairs over time to identify trends and patterns. Traders can conduct analysis using various technical indicators and chart patterns. Here are some of the most common chart patterns employed in forex chart analysis:
Head and shoulders pattern
Head and shoulders is a reversal pattern that indicates the conclusion of an uptrend. There are three peaks, with the central peak being the tallest. The pattern is complete when the price breaks below the neckline, which is a support level connecting the two shoulders.
Patterns with a double top and double bottom
The double-top reversal pattern indicates the ending of an uptrend. It consists of two peaks of roughly equal height separated by a decline in price. The pattern is complete when the price breaks below the trough, which is a support level.
You may also read: 5 things to know before the stock market opens
Double bottom is a reversal pattern that indicates the completion of a downtrend. It is the opposite of the double-top pattern and consists of two roughly equal-depth troughs separated by a peak. The pattern is complete when the price breaks above the resistance level represented by the peak.
Triangle formations
Triangle patterns are continuation patterns that indicate an extension of the current trend. There are three varieties of triangle patterns, including symmetrical triangles, ascending triangles, and descending triangles. A symmetrical triangle has a series of lower highs and higher lows, whereas an ascending triangle has a horizontal resistance level and a support level that slopes upwards. A descending triangle has a horizontal support level and a resistance level that slopes downward.
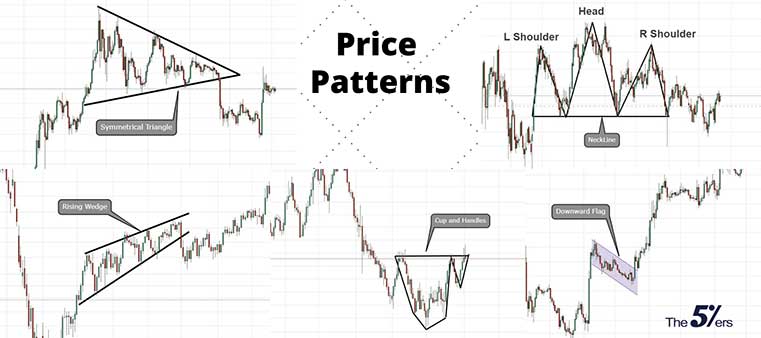
Source: the5ers.com
Final words
Forex indicators are indispensable for forex market analysis and trading. Traders must comprehend the various patterns and how to interpret them to make informed trading decisions. In addition, they may employ different strategies to capitalize on multiple movements, including trend-following and countertrend strategies. Forex chart analysis is the process of analyzing the price action of currency pairs over time to identify trends and patterns. Traders can conduct analysis using various technical indicators and chart patterns. By mastering forex chart analysis, forex traders can increase their chances of success.


Comments
Post has no comment yet.