Financial markets went through one of the toughest bear markets in history. Many investors are now focusing on what’s going to happen with the new year coming. Let’s look at several charts, which according to the tweet from Charles Edwards, indicate irrational fear.
1. AAII sentiment is the lowest since 1990
AAII is an American Association of Individual Investors, a well-known contrarian indicator. It basically shows the percentage of investors who are bullish, bearish, or neutral on the stock market.
Related article: Retail investors expect the bottom in 2023 – warning sign?
The number is now as low as it was in 1990, when the market bottomed. It’s even lower than in 2008, and the second worst in history. Charles Edwards, the CEO of Capriole fund, explained that the last time this indicator was so low, “it was the bottom and start of a huge 10-year bull run.”
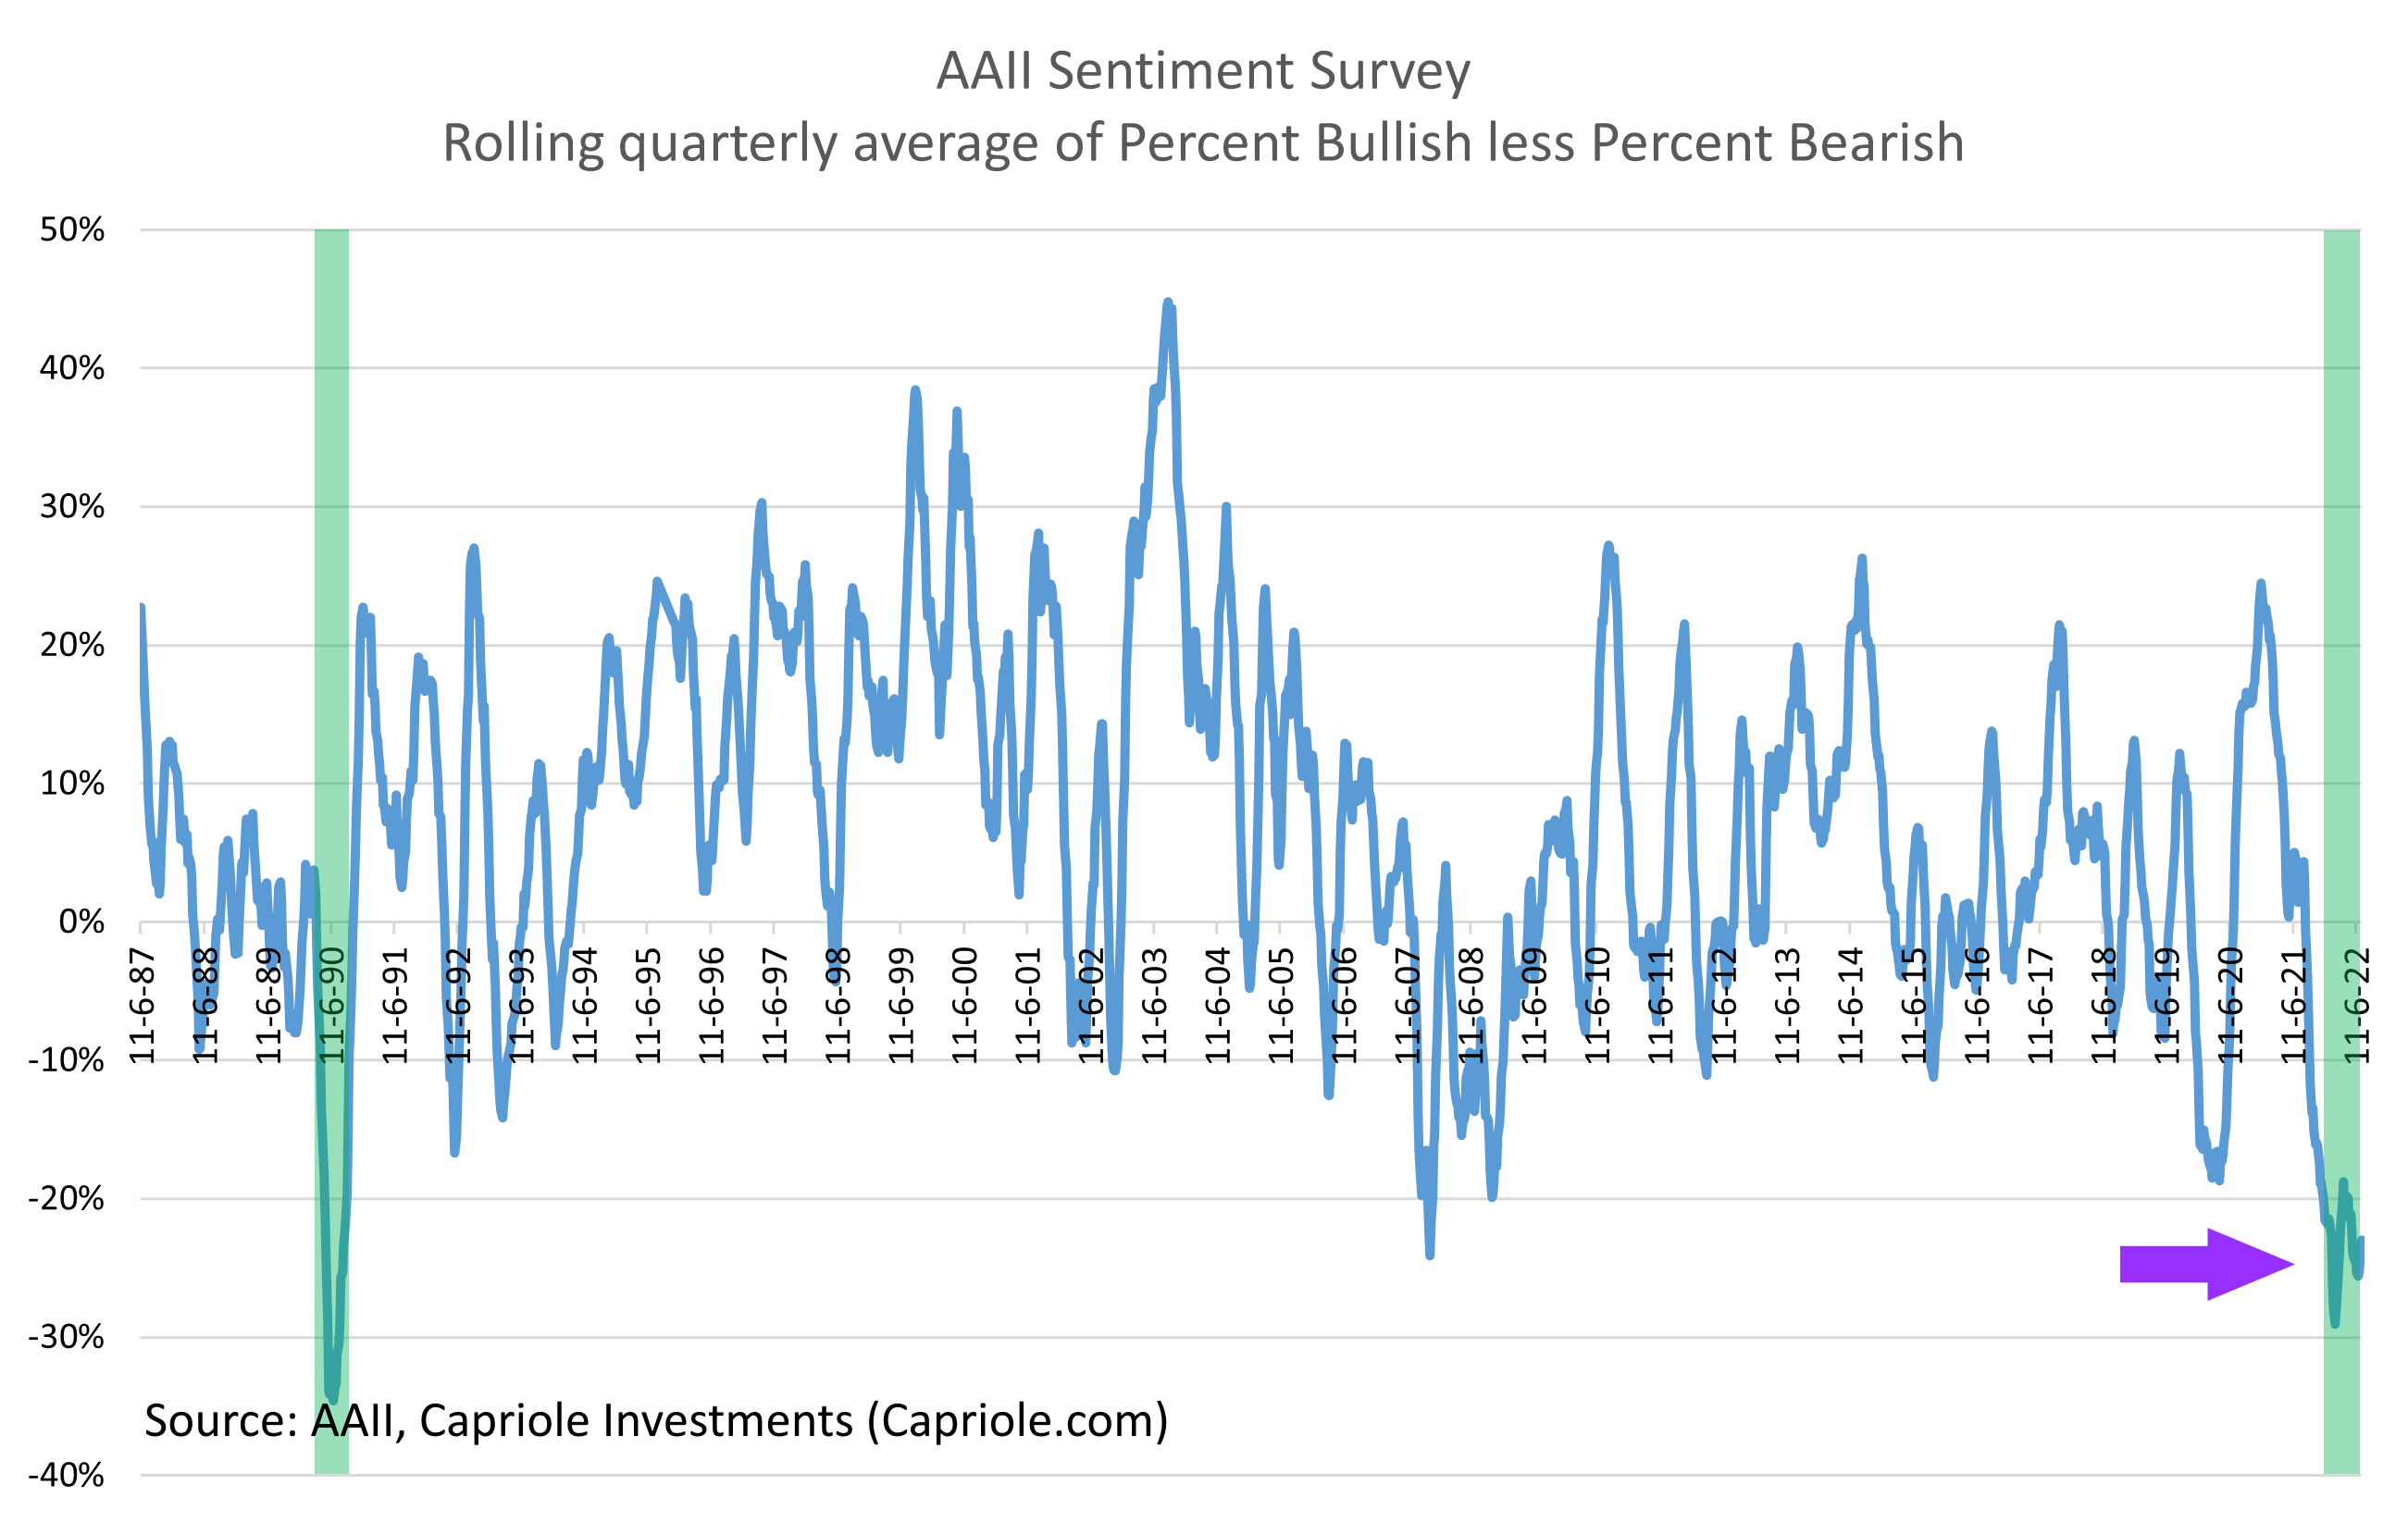
AAII sentiment survey, source: twitter.com
2. ZEW index at levels from 2008
The indicator of the European sentiment is calculated by ZEW, and it has recently reached 2008 levels. This is the second lowest sentiment result in twenty-two years, and we all know what happened after 2008.
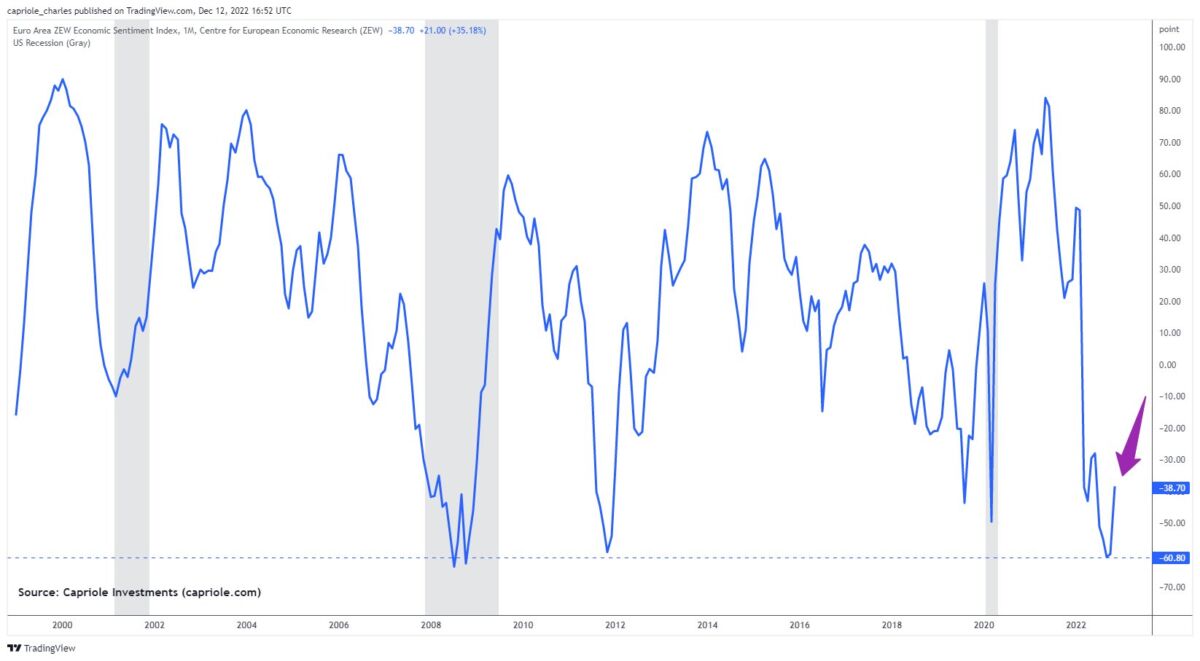
Euro Area ZEW Economic Sentiment Index, source: twitter.com
After the DAX 40, the German stock index dropped 50% in 2008, it rose 100% in the next few years. Other European indexes behaved similarly, proving that ZEW represents a solid sentiment indicator of the European stock market. However, DAX has been tumbling ever since the ECB raised interest rates on December 15th, pointing to another potential selloff in the near future.
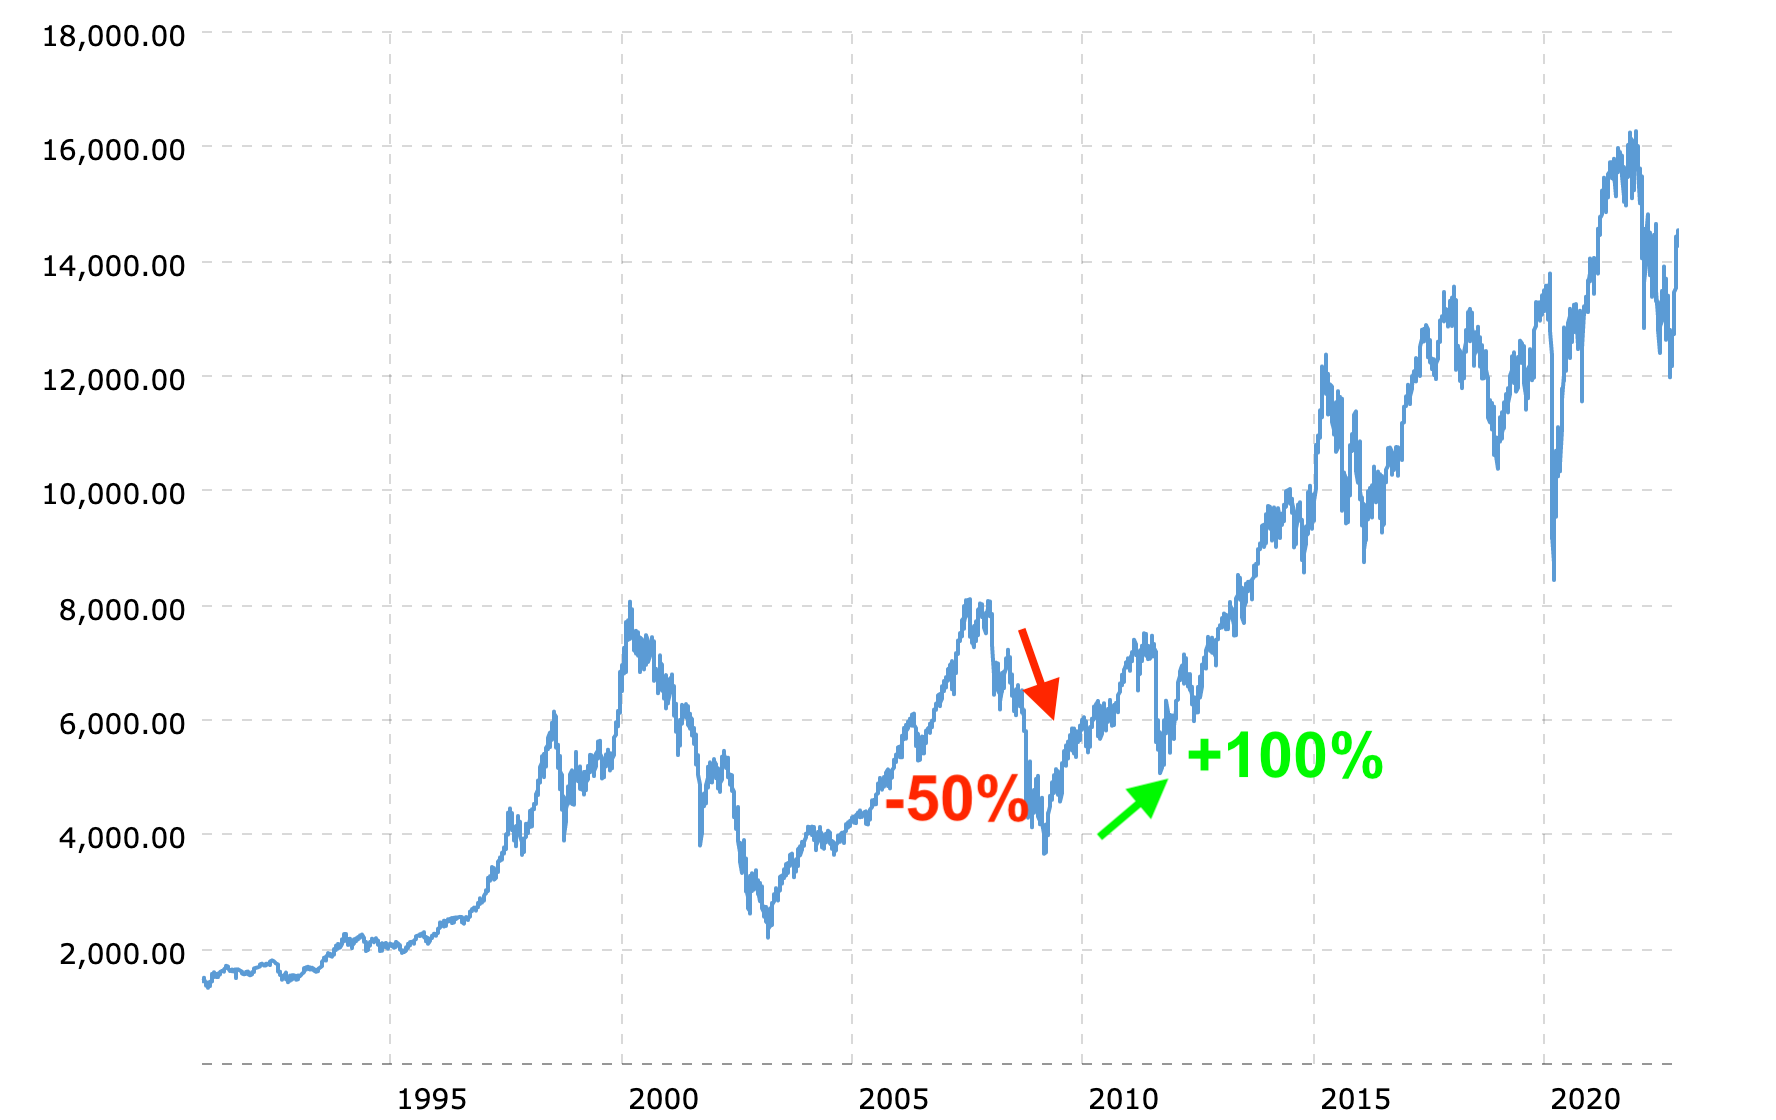
DAX long-term chart, source: macrotrends.net
3. Record equities downgrades
Analysts have been overly bearish on stocks, grading them down at record levels. Equities were in a similar situation in 2011, 2015 and 2020, but always bounced back when they reached significantly low levels. This is the largest downgrade spiral in more than 12 years.
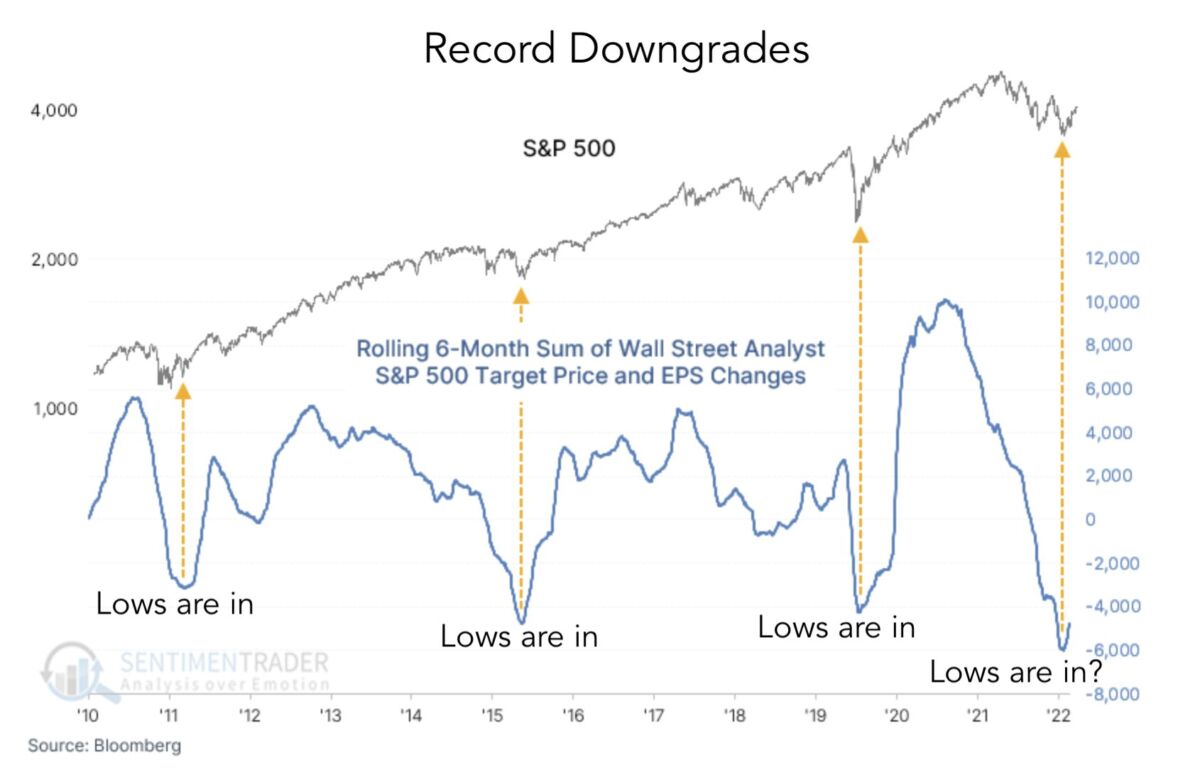
Record downgrades of equities chart, source: twitter.com
4. The US Investor Intelligence flashes green
“The US Investor Intelligence survey is a reflection of the recommendations of over 130 independent stock market editors. This has been a great counter indicator since 1963. The survey shows peak bearishness and is comparable with prior bottoms,” Edwards explained.
Also read: Crypto outflows from exchanges continue, Binance suffers
While this indicator is flashing green, it doesn’t necessarily mean the bottom is in right now. However, it points to a possible bottom in the next few months. All of these indicators show that it may be time to become a contrarian soon. However, let’s also look at charts from a technical and fundamental perspective.
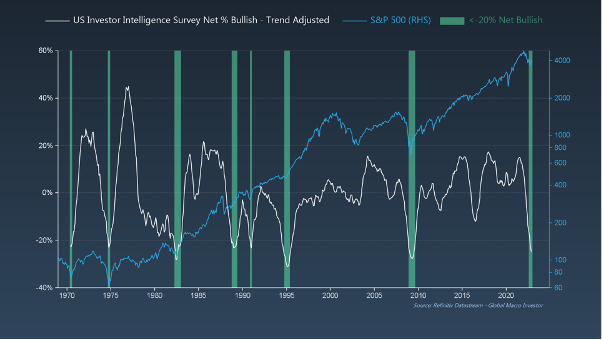
US investor inteligence survey, source: twitter.com
The bottom is almost in. Or is it?
The Fed may increase interest rates even more, and the ECB signalled more rate hikes in 2023 as well. This could still send stock indices lower at the beginning of the next year. In my opinion, the approximate bottom will form when central banks stop raising key rates.
The S&P 500 failed to break a crucial trend line and created a pin bar which confirmed a strong sell signal. So even though stocks could rise in the future, it’s probably not happening right now. S&P 500 could be headed back to the support of 3,489, or even lower, depending on the size of the selling pressure.
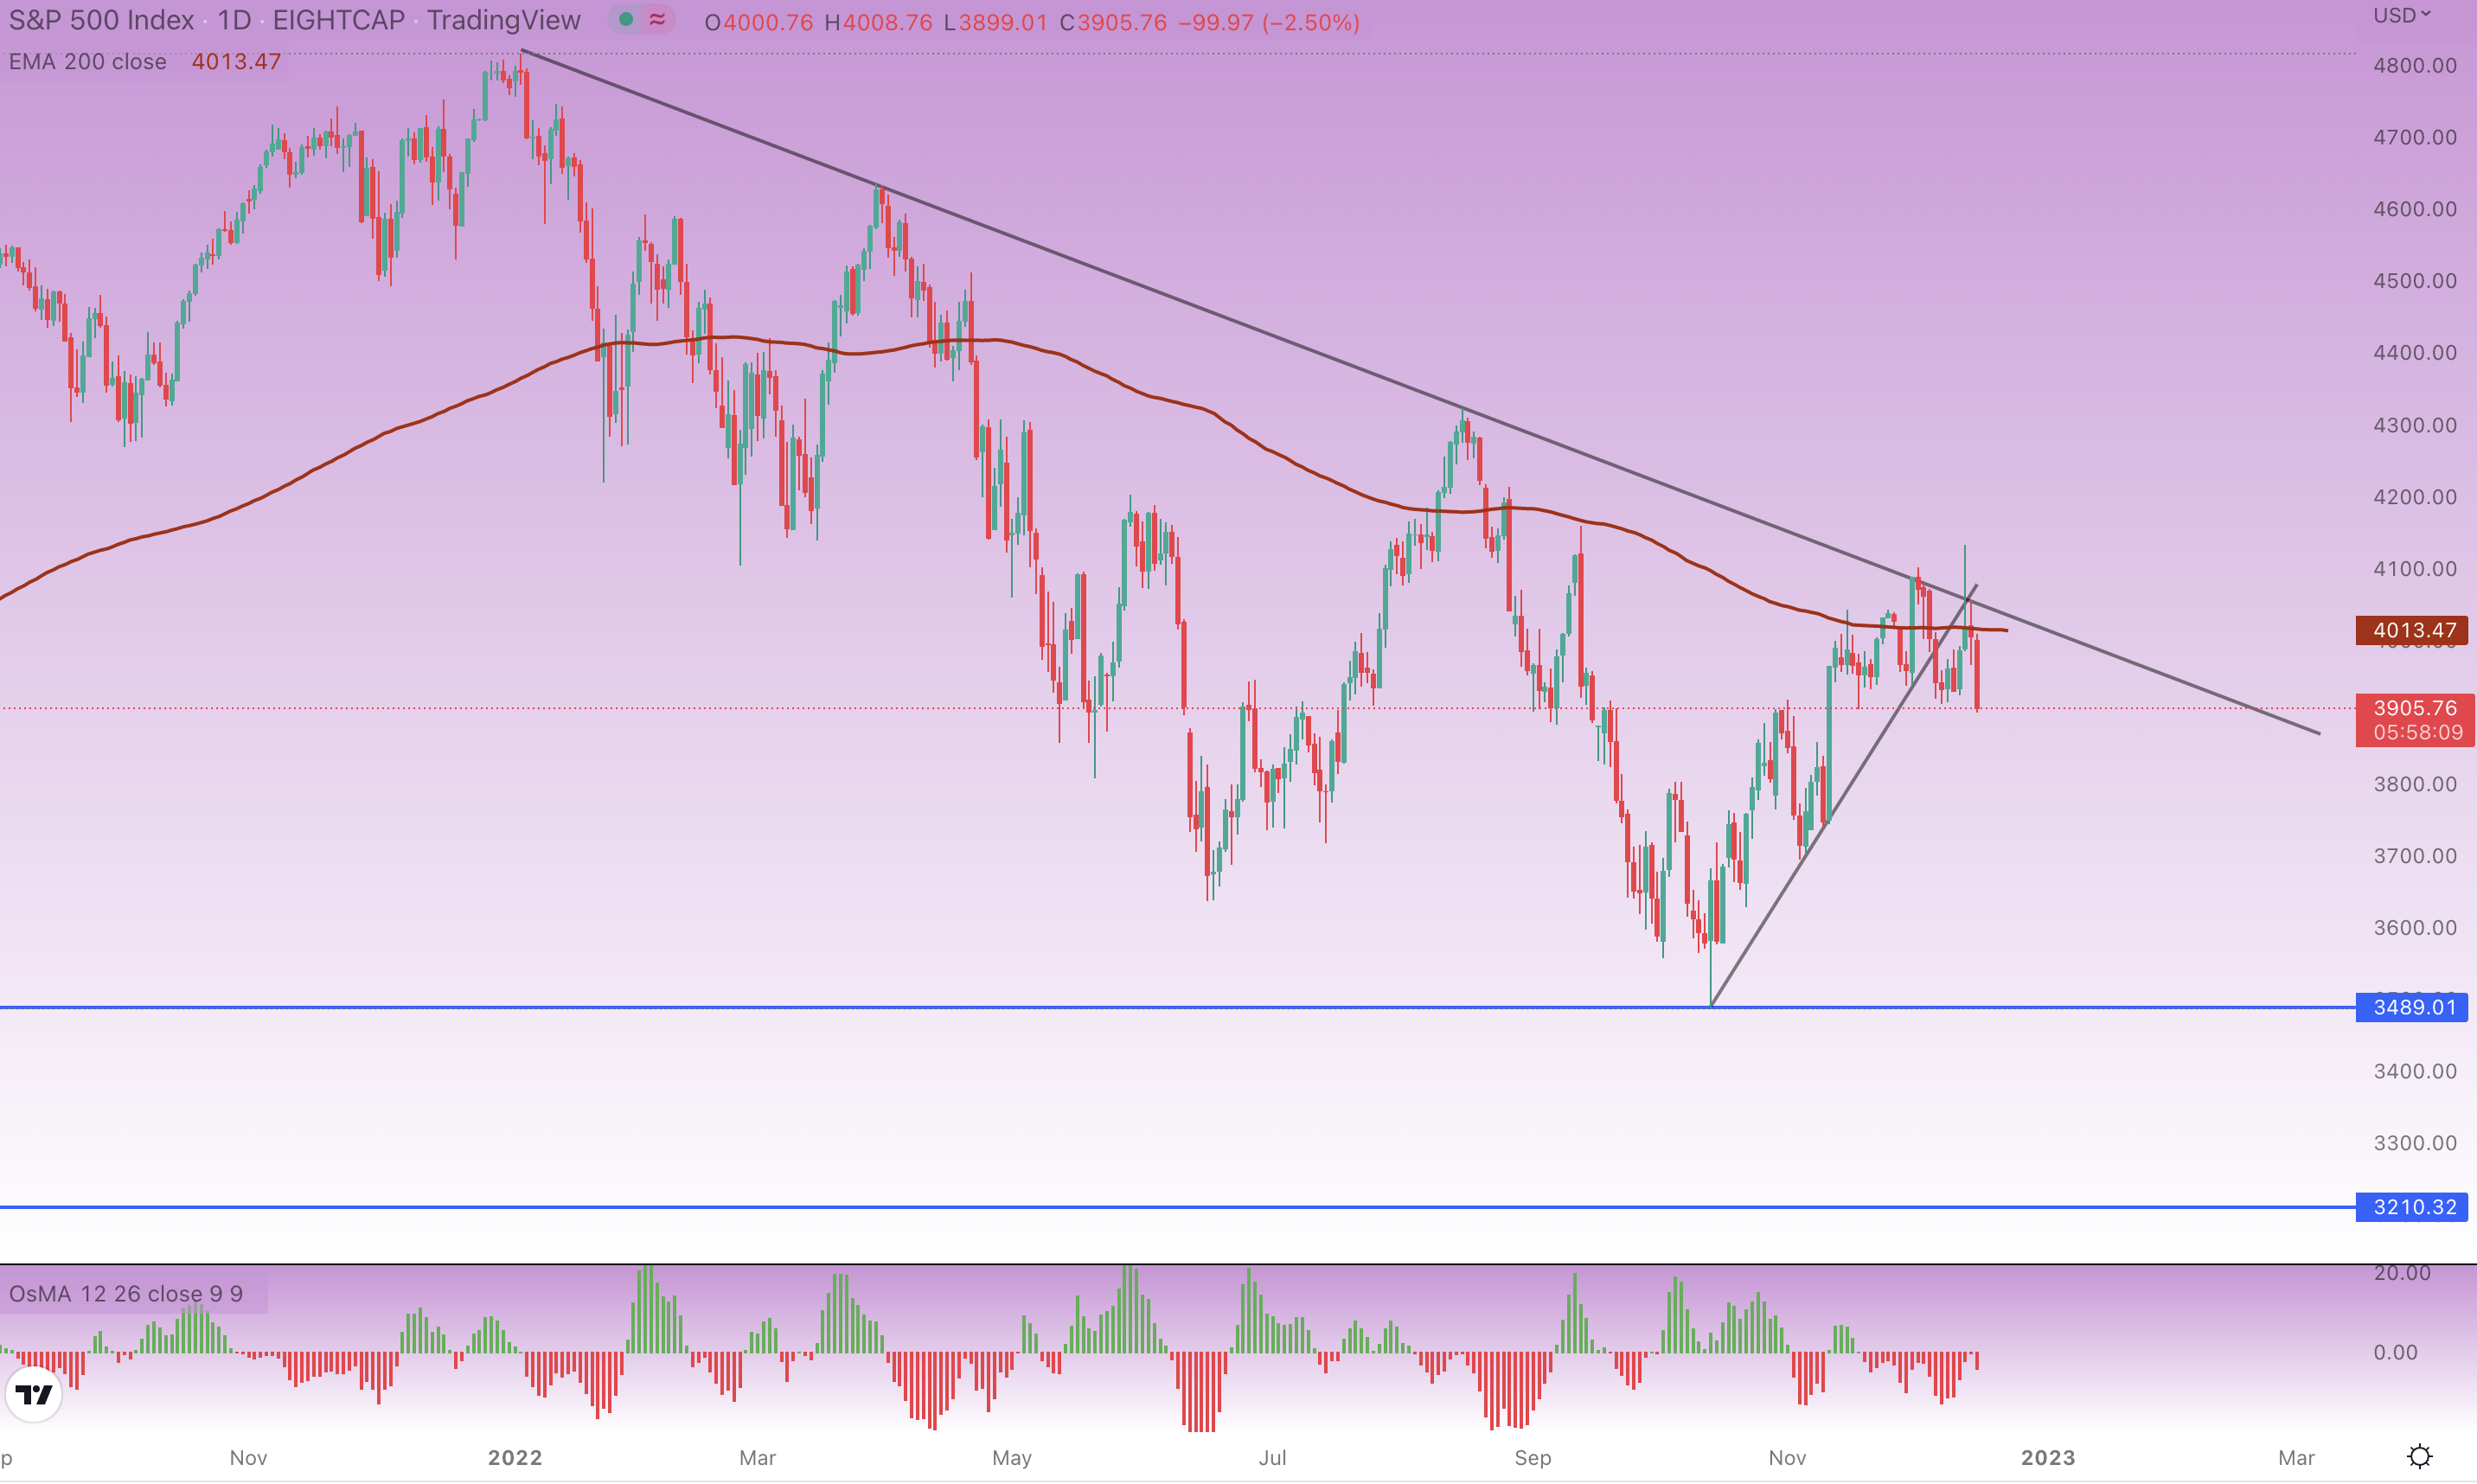
S&P 500 daily chart, source: tradingview.com, author’s analysis


Comments
Post has no comment yet.