The latest asset movements
In the previous week, the stock market significantly dropped after the inflation report, which was absolutely out of consensus, mainly for the core inflation. However, we believe it was the main trigger. We are convinced that the market drop that followed last week was justified, but an easing could occur. There were some signals that bulls were exhausted. Look at the current asset movements from the previous week:
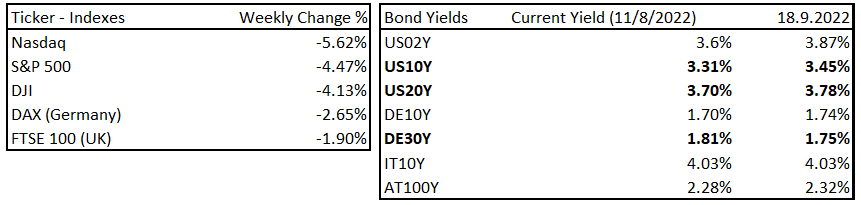
The latest asset movements, Source: Investro analytics team
Read also: Deep inflation analysis on the latest CPI print
Some indications about a pullback
Our team believes there are some indications that could drive the market for the next 1-2 weeks ahead. Although we do not guarantee anything, in the option market there is an interesting play. If we look at the options ratio – puts (shorts) versus calls (longs) – it reveals the market logic. We measure this indicator by the 3-day moving average.
You may also like: FedEx wars about recession
Nevertheless, it is not reaching absolute extremes but is higher than 90% of the time. It is the great contrarian indicator. Currently, the put/call ratio (average) is at 1.05, which implies that the market is hedged as participants bought more puts than calls. 90% of the time, it is strongly below one. The issue is that during the next week there is a FOMC meeting, which could bring more volatility into the markets, so such an indicator can go to higher extremes.
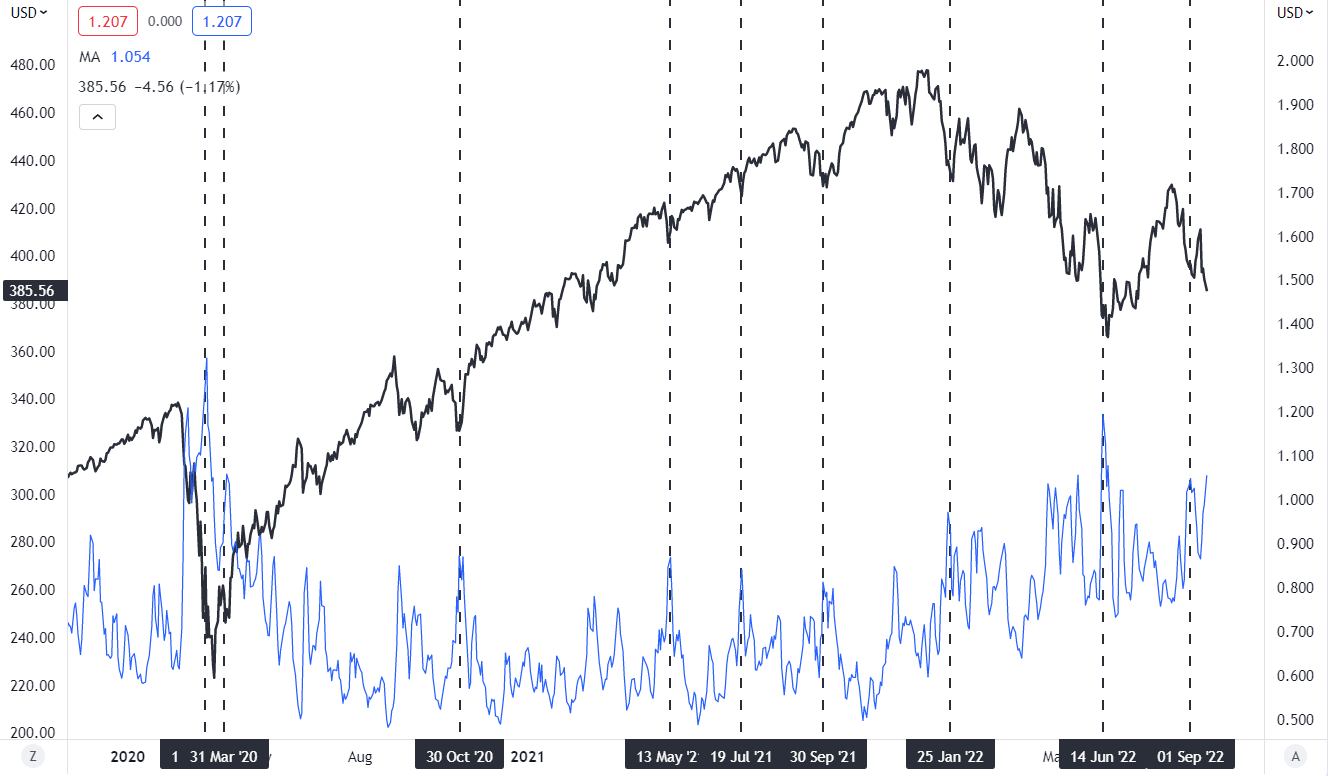
SPY (S&P 500) and Put/call ratio, Source: Investro analytics team via Tradingivew
This week’s volume was among the highest in option history, with trillions of dollars of options expiring on Friday. In the next chart, we can see the average weekly return in indexes one week into options expiration and the next week following. While the 3-year trend remains negative, with increasing volatility, the next one is “usually” followed by a market rally. We think that the increase in volatility in 2022 could be caused by the fact that market participants are buying and selling a lot more options.
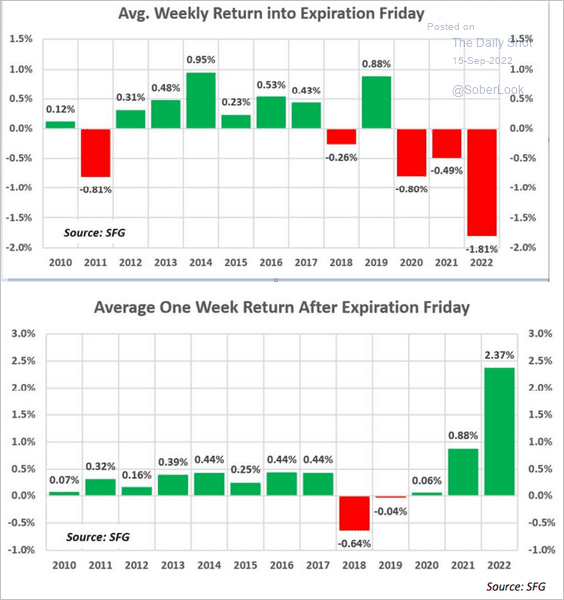
Average Weekly return into/after expiration on Friday, Source: SFG via The Daily Short
SPY short selling at short-term extremes
One of the very strong signals at our previous bearish thesis on S&P 500 was caused by aggressive short-covering.
According to fool.com:
“A short cover is when an investor sells a stock that he or she does not own, it is known as selling the stock short. Essentially, short selling is a way to bet that the price of a stock will decline. The way to exit a short position is to buy back the borrowed shares in order to return them to the lender, which is known as short covering. Once the shares are returned, the transaction is closed, and no further obligation by the short seller to the broker exists”.
Now we can see a very different situation on the ticker SPY (S&P 500). There is a great amount of short-selling, reaching a June extreme. However, it could still be bigger if the Fed surprises the markets with greater hawkishness. Currently, it is a great contrarian indicator. We measure it with a short-term moving average, as in the previous case with a Put/Call option, but this is a little bit different. There are two bullish hypotheses that support the reversal. Firstly, if short-selling volumes declined (the institutions would sell the position), then the market could rally upwards. That was the case 2-3 weeks ago.
Second, if they do not close their short positions and there is a positive trigger in the market (i.e., the Fed delivering a slightly less hawkish stance), it could quickly rise, as margin calls may be faced. We believe the first scenario is more likely, but it will really depend on this week’s stance from the FOMC. Don’t forget, the idea could be wrong as short-selling volumes could be much bigger as we saw during the COVID-19 decline in March 2020.
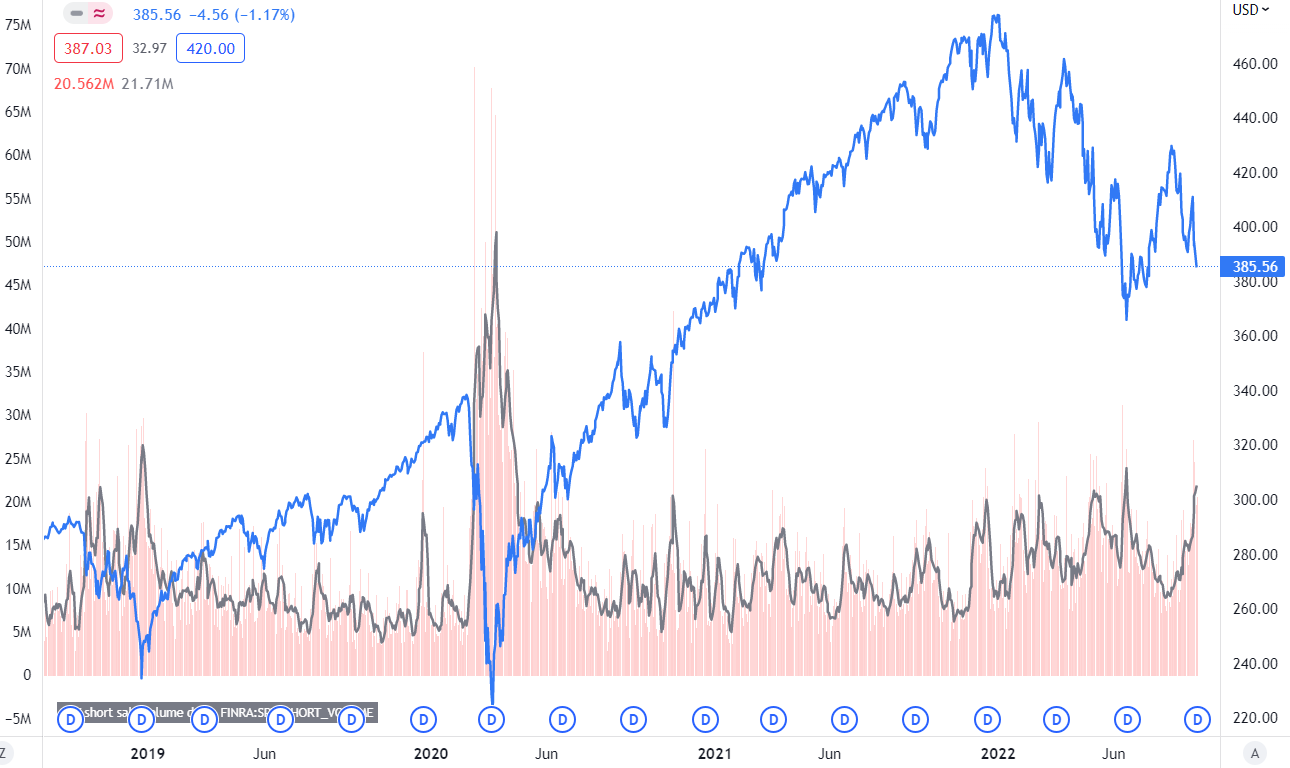
SPY and short sale volumes, Source: Investro analytics team via Tradingview
Trading idea
Although the medium term remains very bearish for stocks, there are some indications that in the next week or two ahead, we could face a very short-term rally. The main reasons are that investors are quite significantly hedged and have opened large numbers of short positions. There are also some gaps in the SPY’s price. However, impacted by fundamentals, we did not change our medium-term move. The outcome of this article is that when you have a short position, it would be prudent to close it at the beginning of the week. Or if you have long positions, to sell it at slightly higher prices.
However, this time is great for bonds, where we remain very bullish in the medium term. On Wednesday, the FOMC will deliver rate hikes and another portion of economic and rate projections for the medium term. These are very important reports, which we will analyse. The market believes that the Fed will deliver a 75 bps rate hike on Wednesday, but the odds of a 100 bps hike are at 15%, a decrease from 35% a week ago. If the Fed shocks the markets with a 100 bps hike, it could surely be a negative surprise.


Comments
Post has no comment yet.