What drove the CPI?
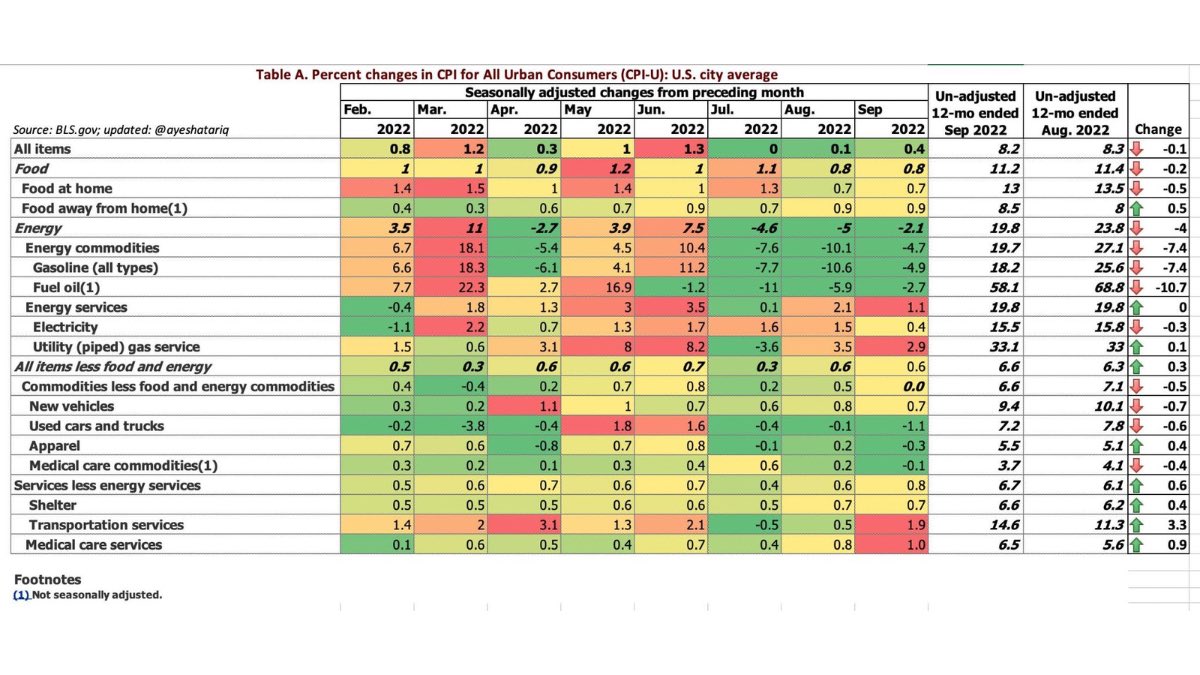
The table below examines what drove September’s CPI, both on a monthly and annual basis. Let’s summarize how the data ended today from the macro-calendar:
The YoY headline inflation (CPI) in September rose to 8.2%, down from the previous month’s 8.3% but more than the consensus estimated at 8.1%. The monthly rise contributed an additional 0.4% growth, thus beating the estimate of 0.2%. The one pure negative sign.
The Core PCE or a similar Core CPI is the most important (lagging) inflation indicator for the Fed. The core CPI rose to 6.6%, up from the previous month’s 6.3% and also higher than the consensus estimate of 6.5%. The monthly Core CPI is the most crucial part of the whole CPI report. It showed that MoM Core ended up up by 0.6%, the same as the previous month. This was more than the estimate of 0.5%, so it was hotter than expected.
You may also like: Weekly macro report – the market is in full hawkish mode
There is a legitimate concern that inflation becomes more structural, mainly in a core way. We do not know if it is that way or not. However, we can look at the table below to summarize what ensured such strong figures.


Comments
Post has no comment yet.