Inflation data from the US
The primary macro data that everybody is targeted on, the Consumer price index in the US, has brought higher than expected numbers. As you can see in the economic calendar below, all measured versions of inflation have risen.

Inflation data from the US, Source: myfxbook.com
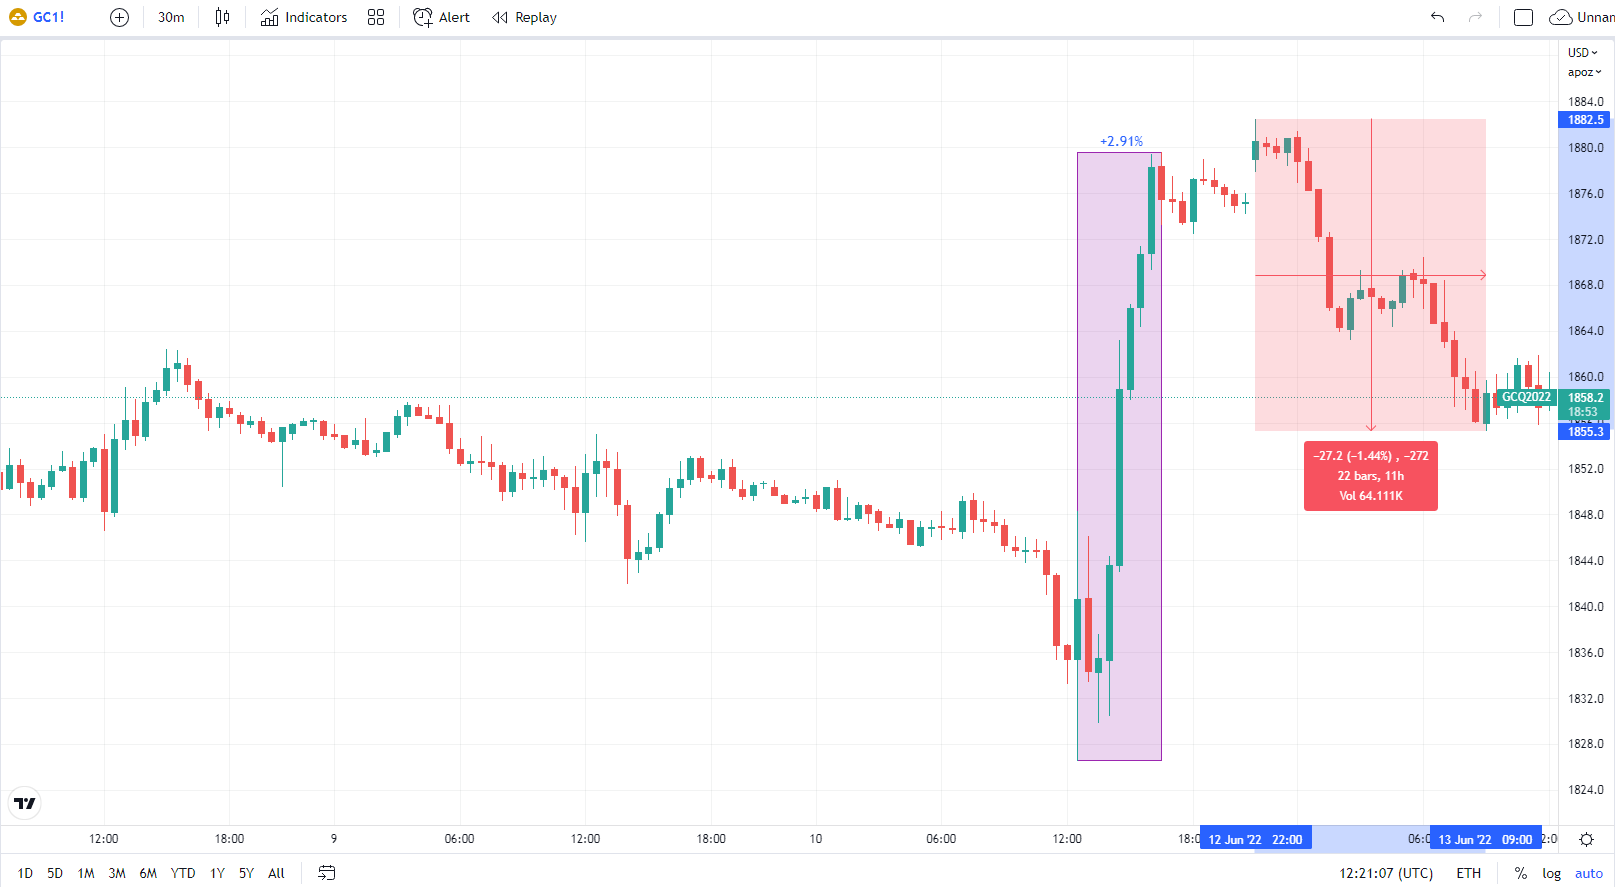
These data started a sell-off in markets. Gold’s correlation with other markets is predominantly positive. Especially in the case of inflation and the Fed’s decision in hiking interest rates. But this time was vividly different, despite the fact that yellow metal reacts to higher inflation negatively. On Friday, gold’s volatility was close to 3% with a low/high range of +2.91%.
We have informed about this topic: Gold accumulates volume before big macro data

Friday’s volatility on GC (Gold Futures). Source: tradingview.com
Demand for safe-havens
Inflation numbers spooked investors throughout markets. Stocks were falling, and the US 10-y treasury yields rose to 3.28%, but precious metals did not correlate as usual. One of the possible explanations could be the shock from data and consequential demand for safe-haven. This week will show the next move for the gold. It is good to have in mind that shock is predominantly an emotion. Especially before the weekend, when markets are closed. Emotion sparks higher volatility, but after the shock soberness comes. The beginning of the new week started with a decline and in the middle of the Monday, gold erased -1.44%.
You may be also interested in: GBP/USD drops to 1-mth lows amid risk-aversion
Monthly VWAP
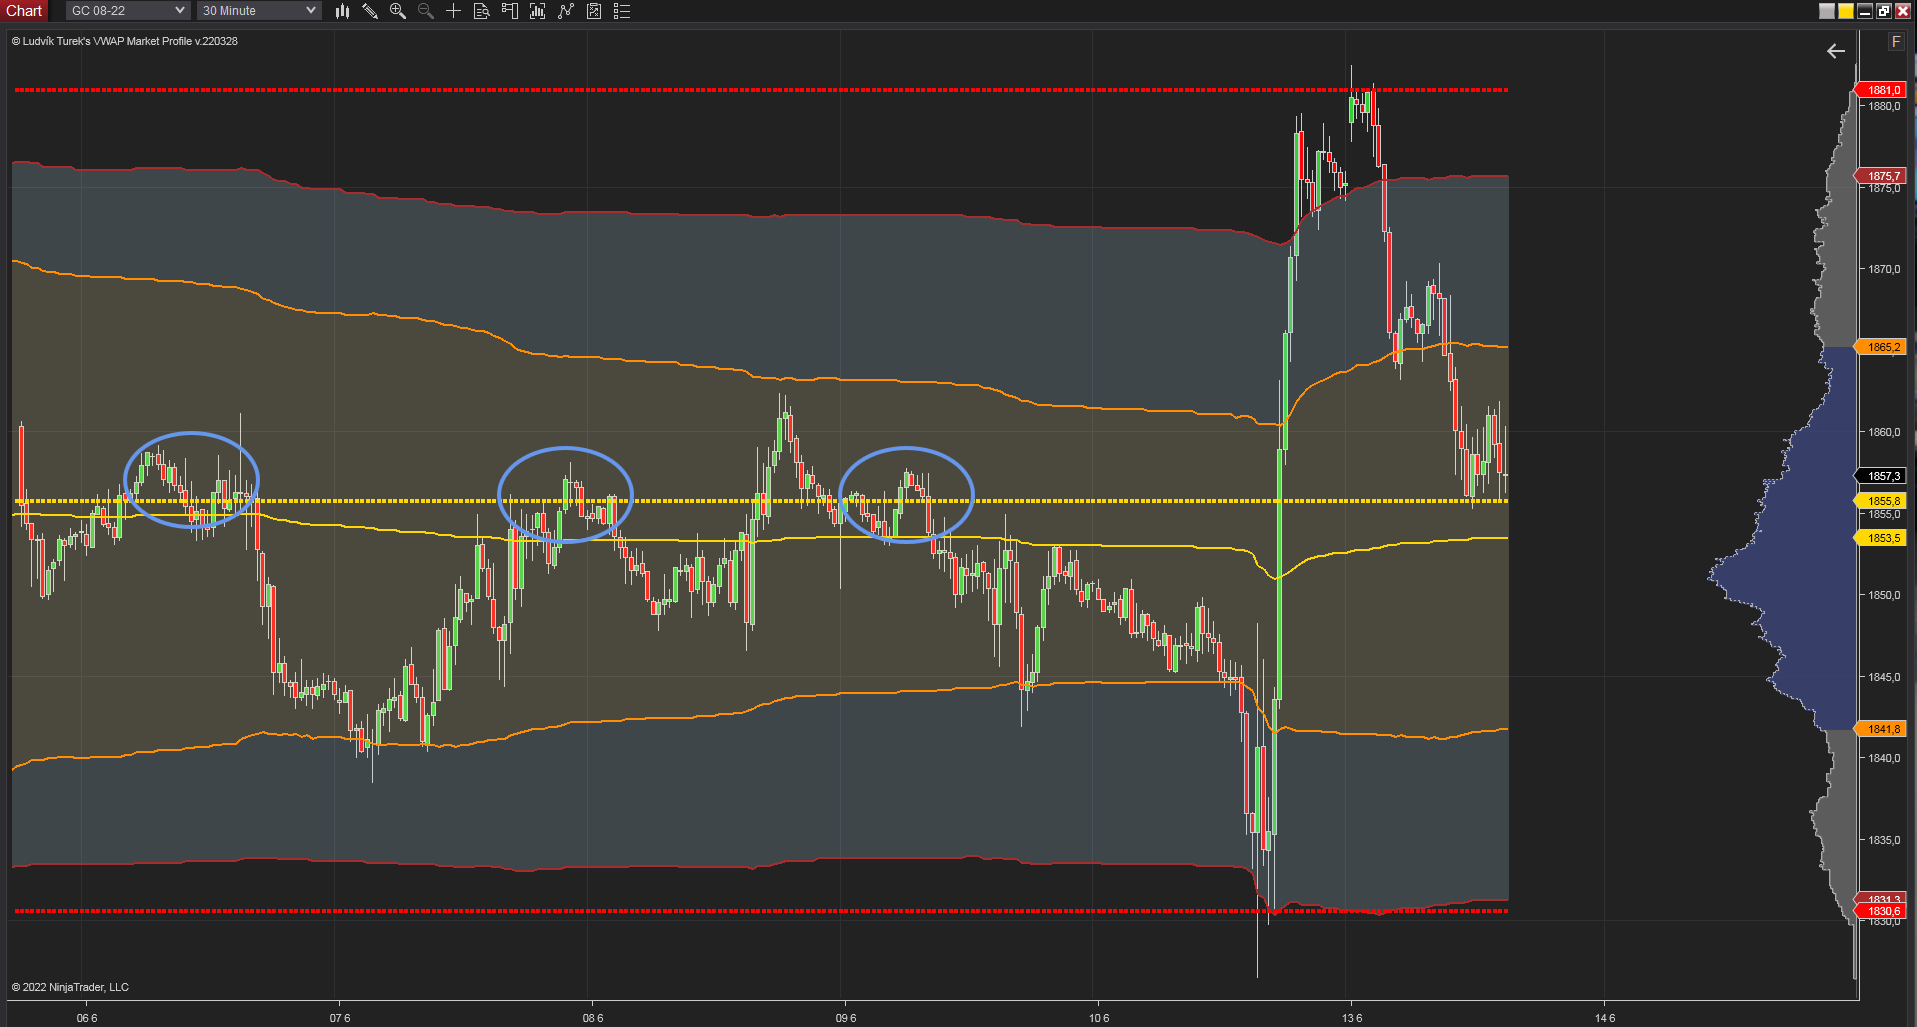
The chart below is shown the Monthly VWAP (volume-weighted average price) on gold futures. As we can see strong support is set by last month’s VWAP (yellow dotted line) on the price 1855.8$ per ounce. Moreover, this level has been tested several times and after the breakthrough on Friday, the price tested it as support. Next support could be level around Friday’s low at 1st standard deviation at 1830.6$. Resistance could be level 1881.0$.

30 minutes chart of GC (Gold Futures), Monthly VWAP. Source: Author’s analysis.
Volatility is high
It is enormously important to be steady and not let emotions to your strategy. In our previous articles about gold, we wrote that gold acts negatively on higher inflation, because of possible hiking the interest rates by Fed. Moreover, the correlation between gold and 10-y US Treasury yields is negative, which means yields are up, gold is down, and vice versa. But it seems that too negative numbers bring higher demand for safe havens and commonly known rules which have been working for a long time could simply stop working. Therefore you need to be patient and work with multiple versions of possible next moves. Higher demand for gold in one day does not immediately mean that the next day this demand will continue.


Comments
Post has no comment yet.