Fed is hiking
Interest rates data from last week’s Fed meeting affirmed the consensus. Central bank raised interest rates about 50 bps to current 1%. A little hawkish remarks from Chairman Powell sent Gold prices to 1910.70 $. Despite this, gold is retreating with current price 1858.8$, which is about 2.7% down from data revealing highs.
We have informed about this topic: Gold awaits Fed’s decision
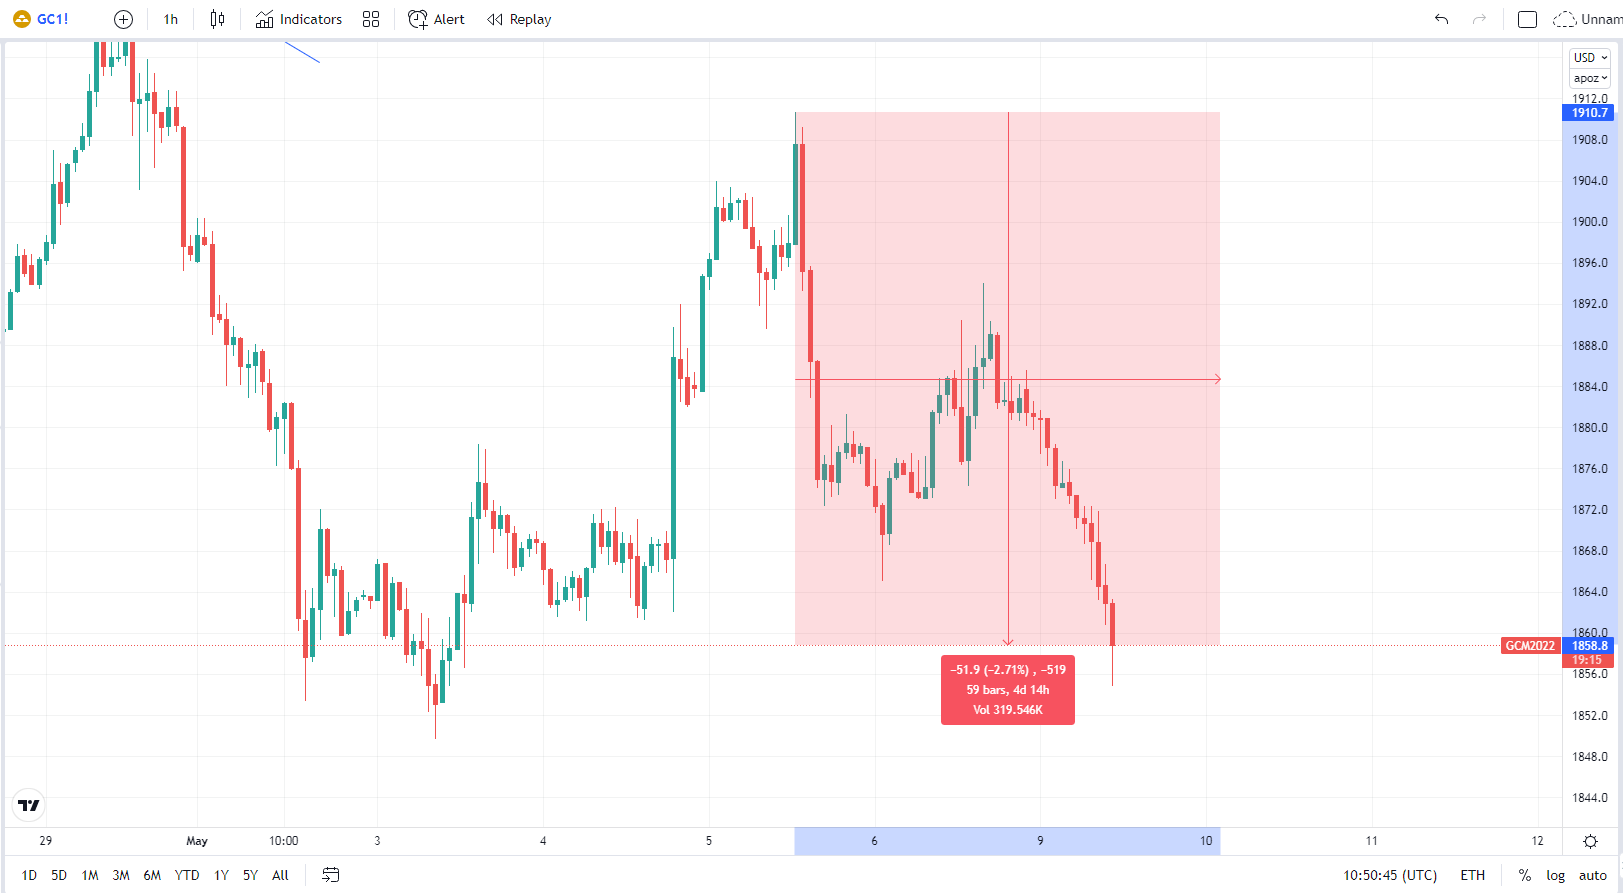
30 minutes chart of GC, 3-day decline. Source: tradingview.com
Inflation data in sight
Fed meeting was not the only important fundament with high impact on the gold price. This week’s economic calendar shows that on Wednesday at 14:30 CET we can expect the US inflation data.
This fundament has a very strong position in monetary policy making. What is very interesting about inflation is that almost all consensus numbers are lower. Which means that the markets expect lower inflation number in the comparison with last measured period. It does not matter if it is monthly or yearly, overall or core inflation.
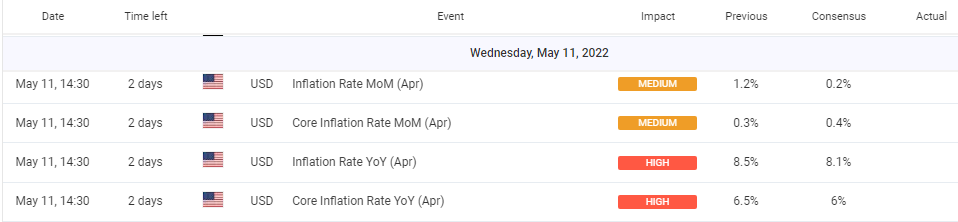
Inflation data in Economic calendar. Source: myfxbook.com
Higher numbers than expected data could positively affect US dollar. It does make sense if we look at chain: higher inflation – higher rates. On the other hand, lower numbers than expected data could negatively affect US dollar, where lower inflation could crack monetary policy we have heard last week.
And possible doubts about interest rates hiking could depreciate US currency. If awaited numbers will be affirmed at the same level as expected, it could cause a high volatility as well. In general, same or lower numbers than expected will probably spark questions about possible inflation peak.
You may be also interested in: Volkswagen is increasing its investment in Spain
Gold at support levels
Charts show that gold declined more than 2.7% under 1860$ and it tests several support levels. First support is at 1859.7$ as POC (Point of control). This level from 3rd of May shows the highest volume of the that day, means the most fair price for gold that day.
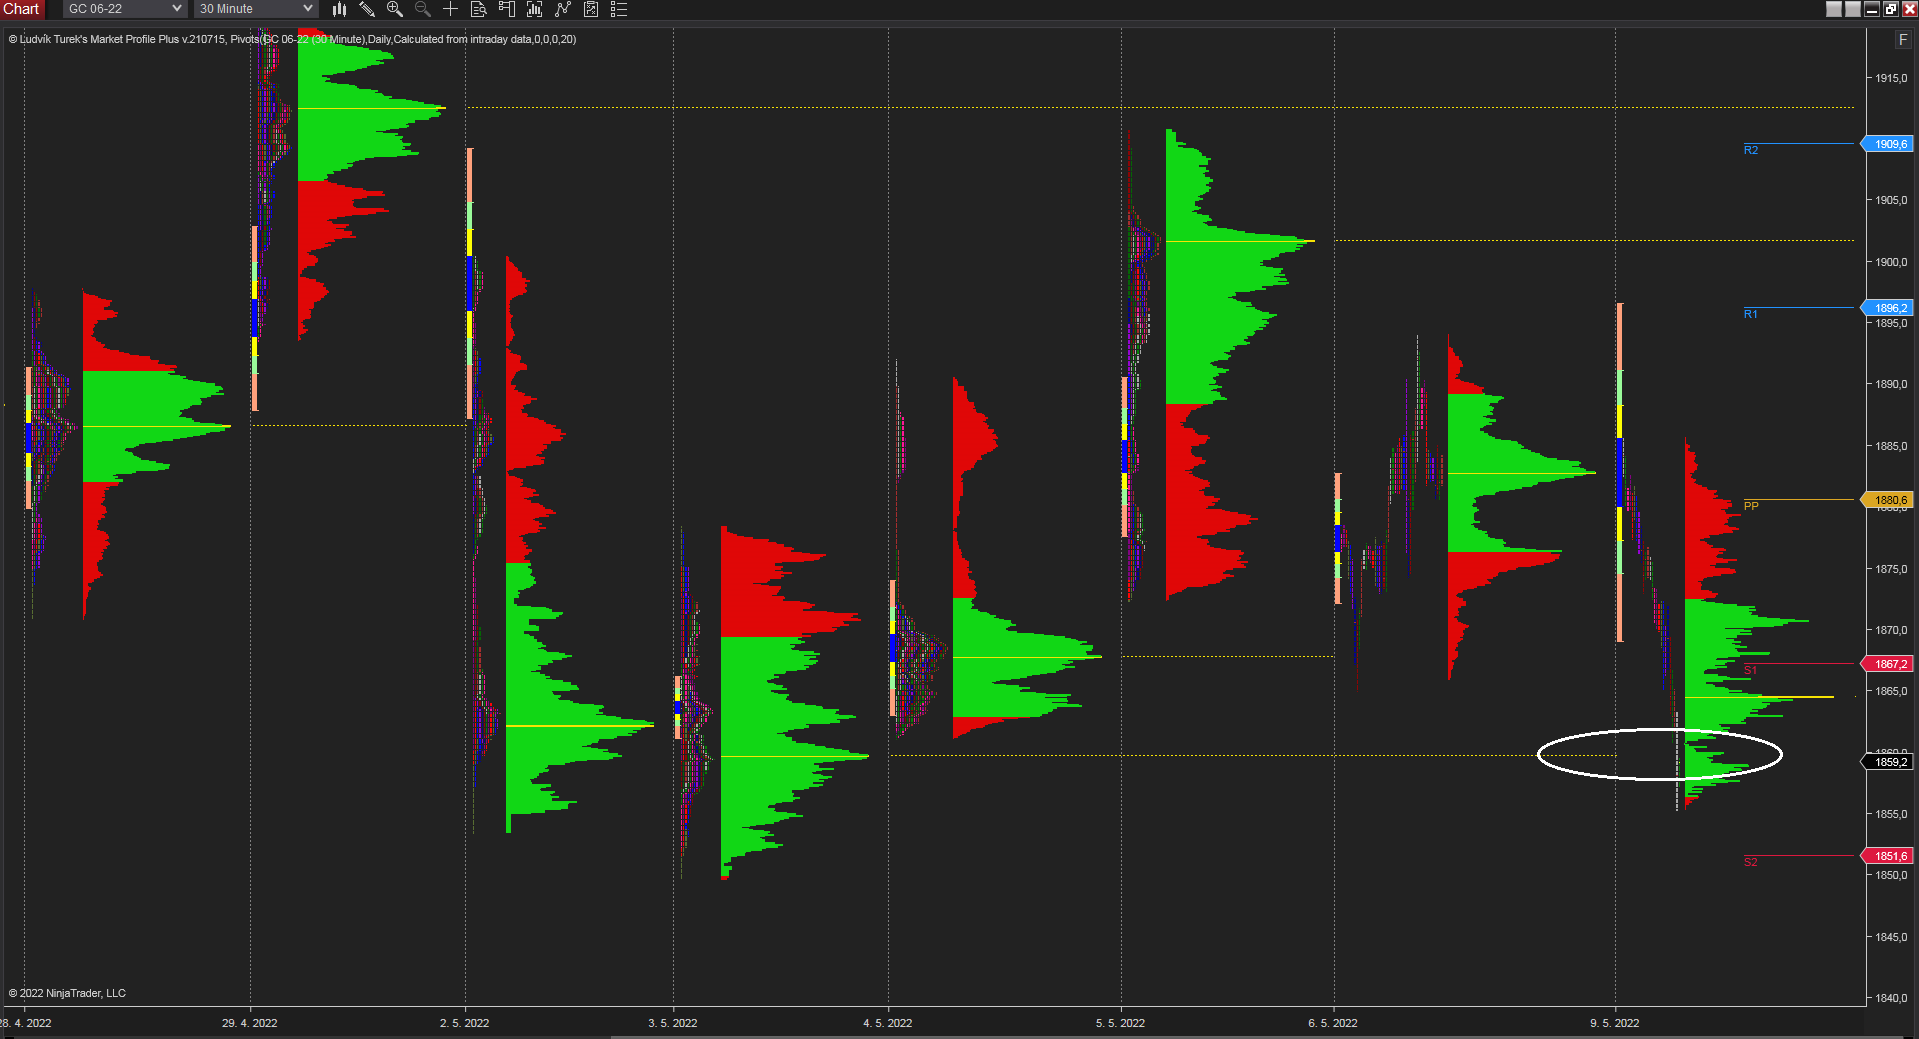
30 minutes chart of GC, Daily Market profile. Source: Author’s analysis
Another support is seen at chart of monthly VWAP, which presents volume weighted average price. 1st standard deviation of monthly VWAP works as support and lays at 1862.5$. We can see that this level was broken, but the break is not affirmed yet.
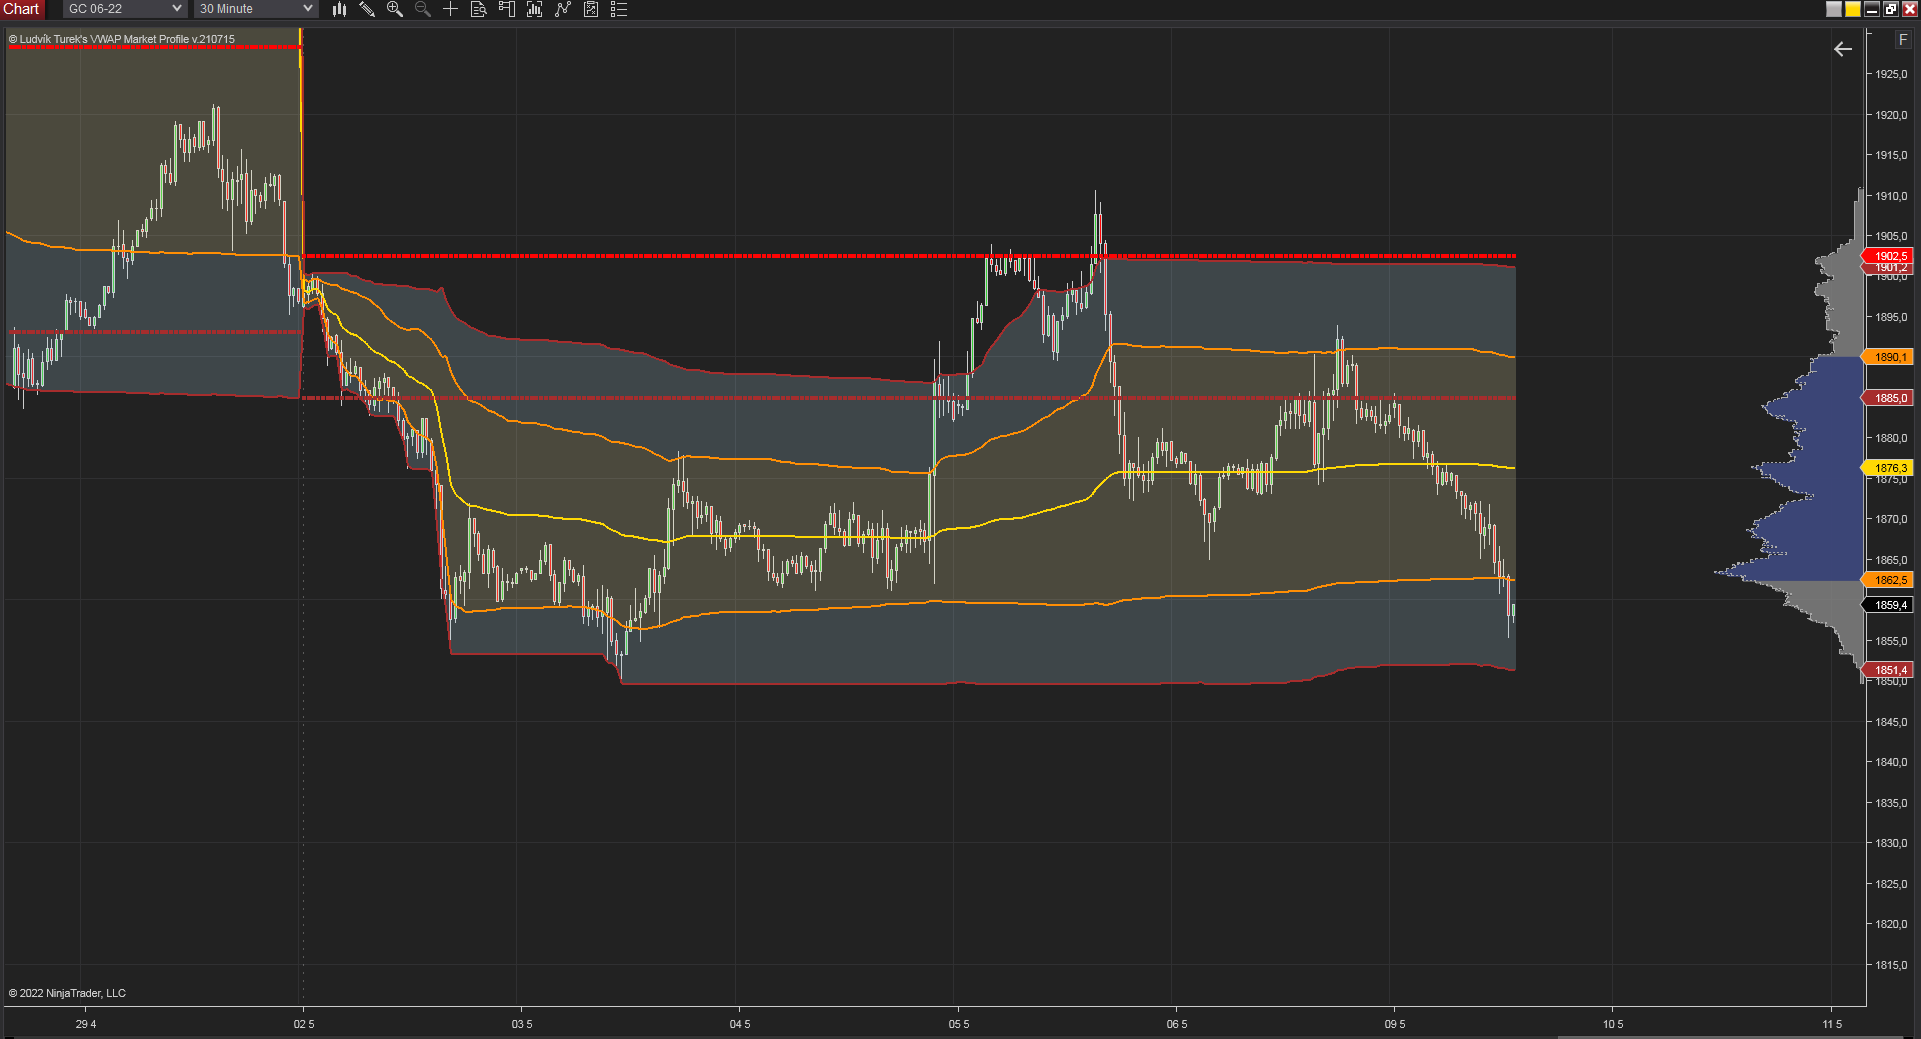
30 minutes chart of GC, Monthly VWAP. Source: Author’s analysis


Comments
Post has no comment yet.