Weak US macro data
Today’s macro data from the USA delivered lower than expected numbers. ISM Manufacturing PMI has 50.9 points, but the expected number was 52.2, with the previous 52.8 points. That means the index shows lower economic activity in the USA.
Related article: OPEC has significantly increased its oil production
These data have a negative impact on the US Dollar. Thus, gold is affected because of the commodity’s main denomination in US dollars. Gold is gaining 1.74% (18:00 CET), almost a $30 move in the price of a yellow commodity.
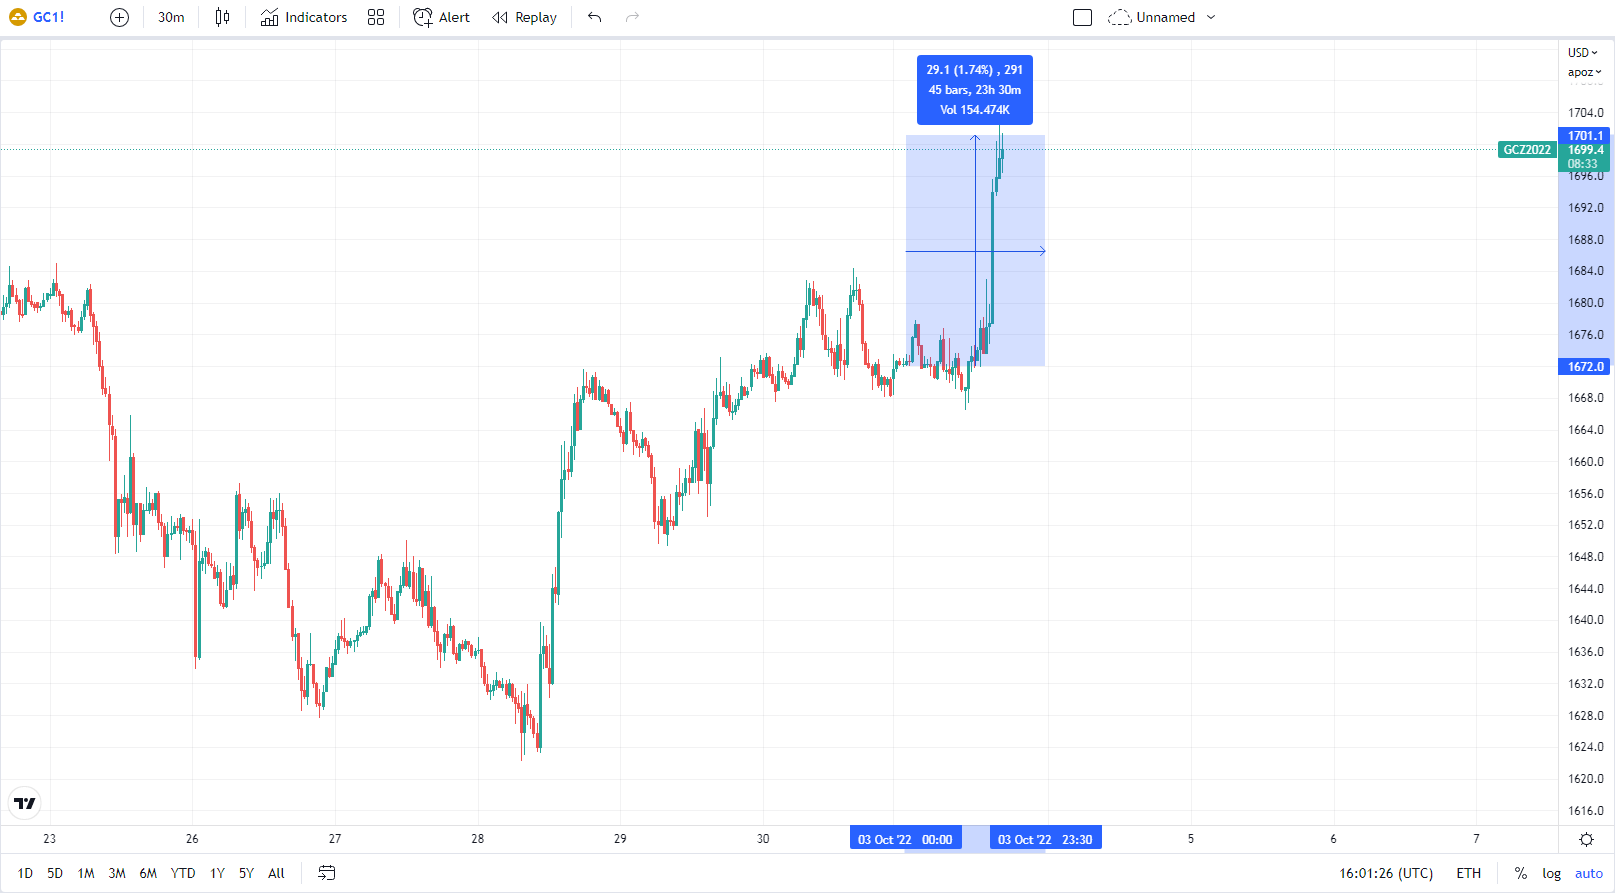
30 minutes chart of GC (Gold Futures). Gold’s reaction to weak macro data. Source: tradingview.com
The importance of the $1670s area
Two weeks ago, gold fell into $1660 – $1680 territory. After one week, gold went down for a few days but climbed back (blue rectangle). Today the US macro data delivered lower than expected data, and the dollar has weakened.
Moreover, gold appreciated and moved out of the mentioned area. This elevation was guarded by monthly VWAP as a resistance at the level of $1688.4, highlighted by the pink arrow. The move can reach resistance at around $1720 area.
Read more: Inflation in Europe is skyrocketing as ECB fell asleep
The important is a peak in the volume histogram on the right of the chart (highlighted by a white arrow). This volume has been set in an early morning trading session. This peak in volume can be seen as a potential support area. This does not mean that gold will go up. It just shows the importance of the $1670s area.
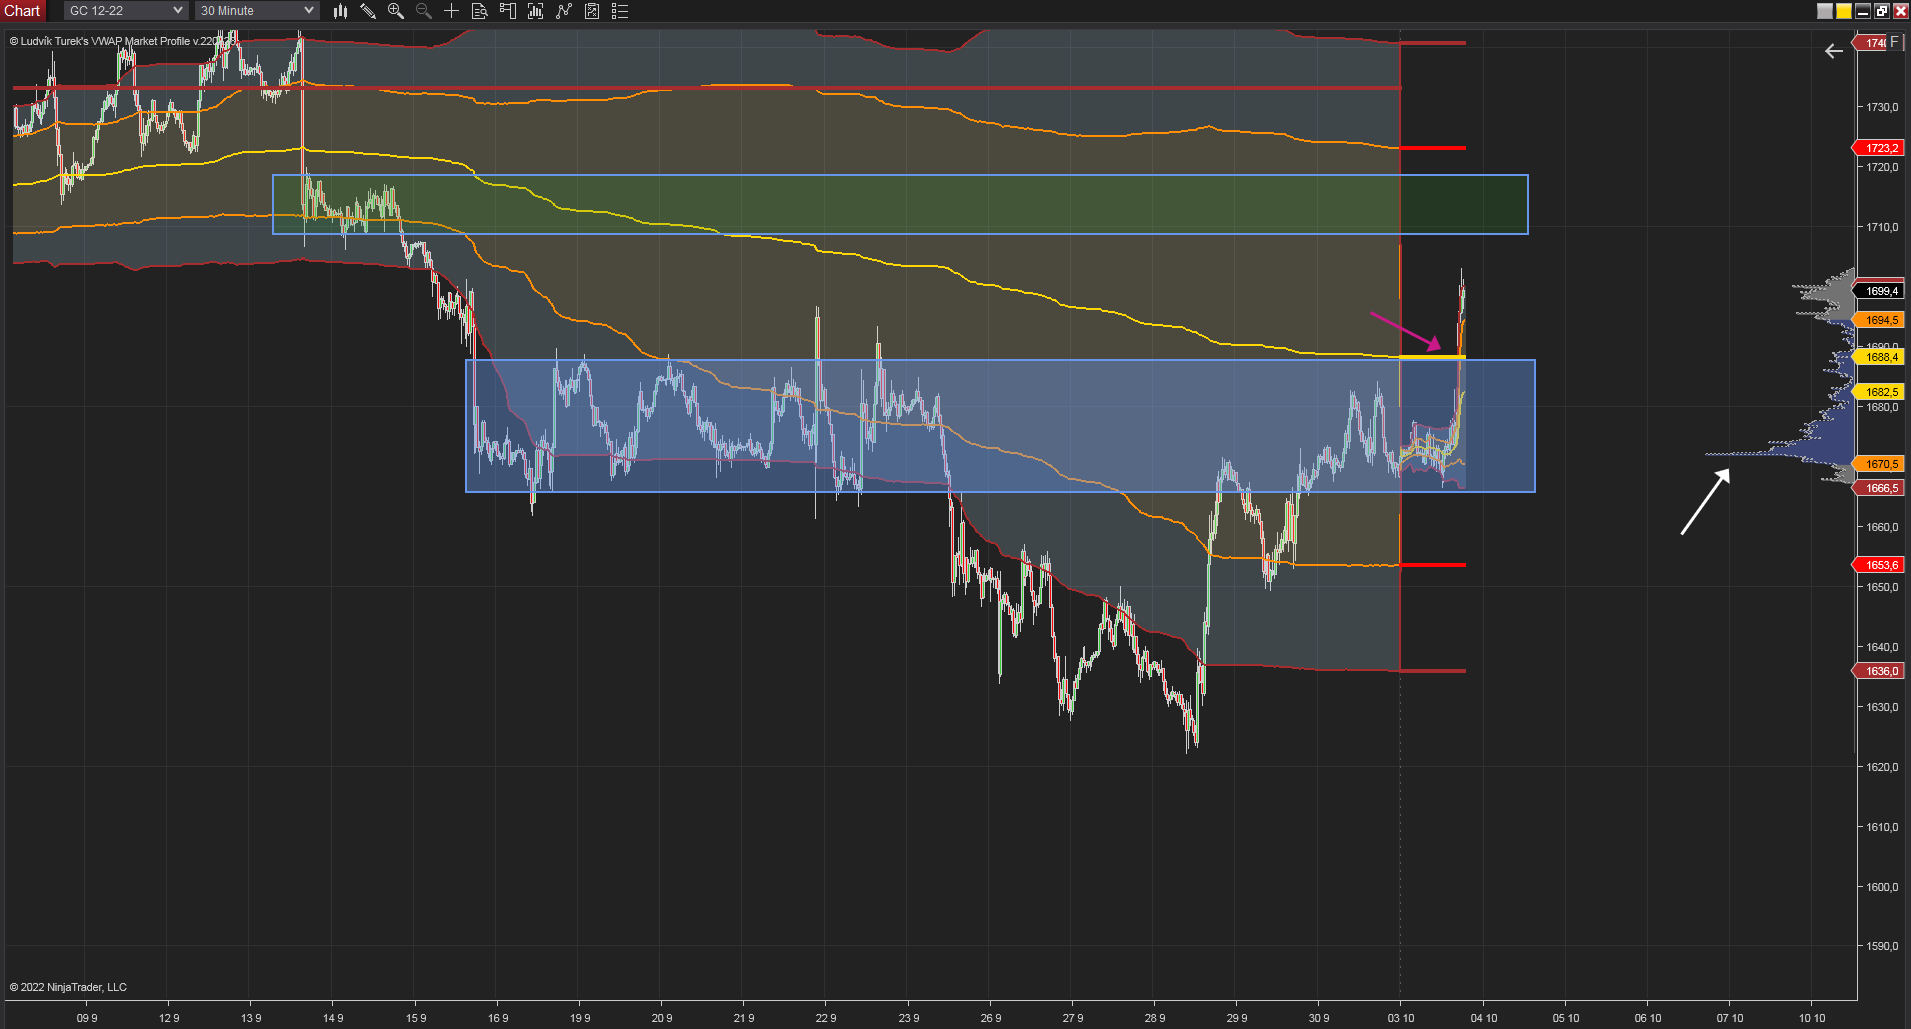
30 minutes chart of GC. Monthly VWAP and $1670 area. Source: Author’s analysis
Safe haven still in the play
Gold has been in a downtrend for several months. This is because the current monetary policy in the world has a negative impact on the yellow commodity. But it seems investors rediscovered the demand for safe havens. And gold is one of them. Therefore, gold is not doomed. It is still in the play as a safe haven.
But there must be specific conditions. And weaker economic data and possibly deeper recession could be those conditions. Gold declines and the current trend stays, but it is important not to forget that precious metal is a safe haven.


Comments
Post has no comment yet.